ITL-97629c07731e
Juan Li, MD · Updated November 17, 2026
Watch the video
Key points
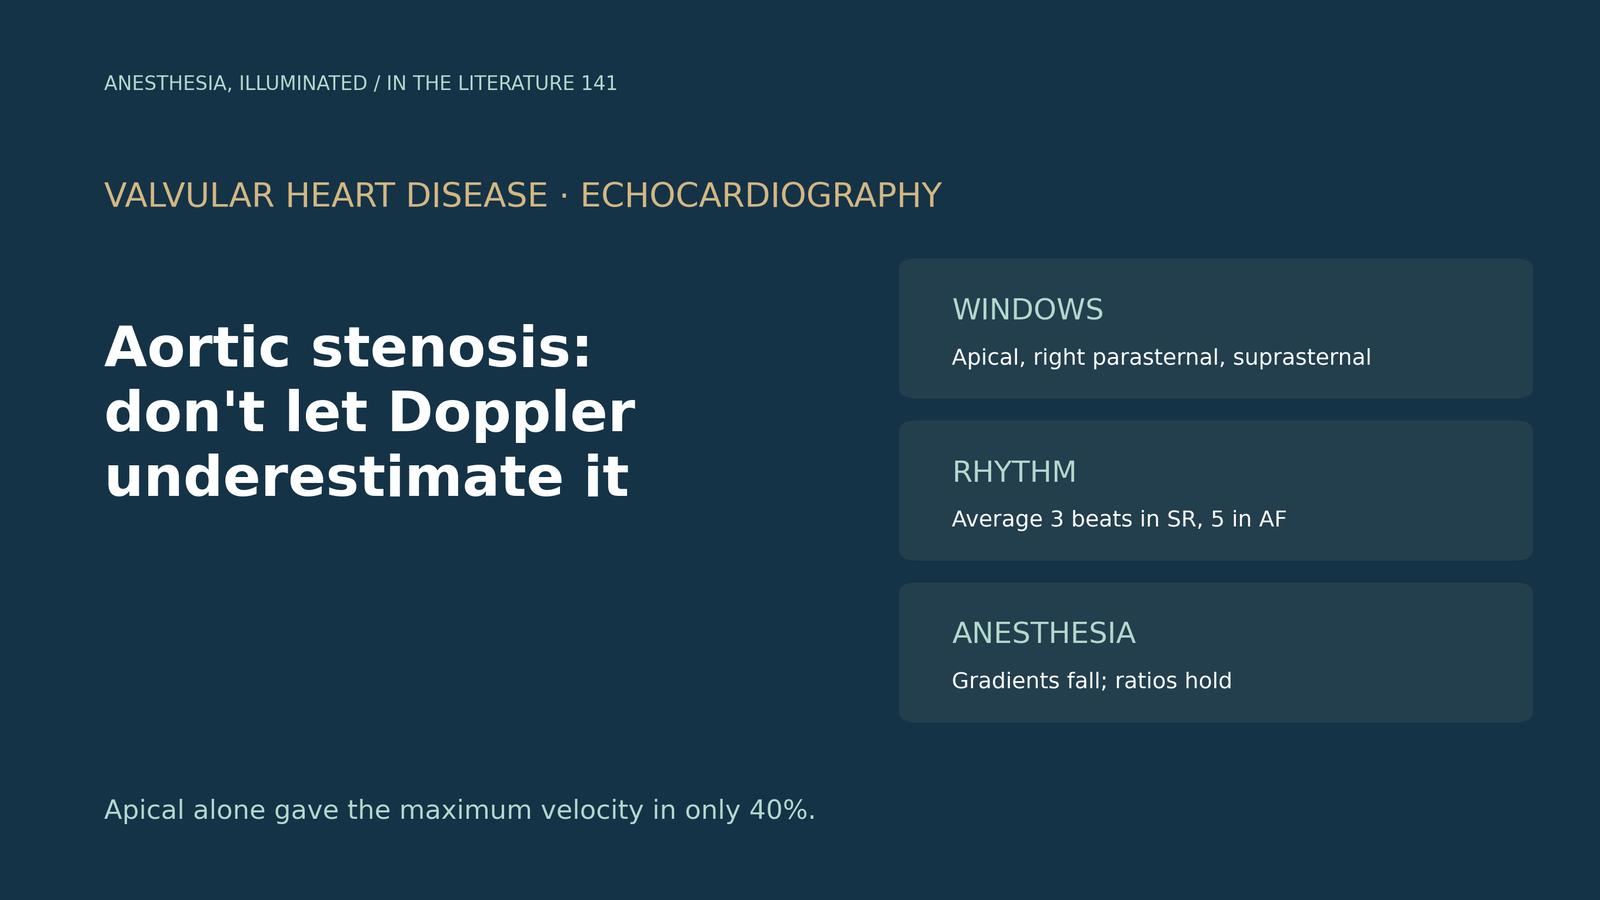
- The highest velocity is often not in the apical view. The apical window gave the maximum velocity in only 40% of patients, and the right parasternal window in up to 50%.[1]
- Missing it changes the grade. Without nonapical windows, peak velocities were underestimated in up to 50% of cases; 8% of patients were misclassified from high- to low-gradient severe stenosis, and 15% from severe to moderate.[2]
- Guidelines therefore call for a multiwindow approach, with at least 3 beats averaged in sinus rhythm and at least 5 in irregular rhythm.[3], [4]
- Atrial fibrillation lowers the gradient. In patients with similarly small valve areas, the mean gradient was lower in atrial fibrillation, and low-gradient stenosis was more common.[5]
- Under anesthesia, numbers fall. In 199 patients, intraoperative TEE gave a lower peak velocity (3.97 vs 4.51 m/s) and mean gradient (38 vs 51 mmHg) than preoperative transthoracic echo; ratio measures were more stable.[6]
Before aortic valve replacement, a transthoracic report from the apical window shows a peak velocity of 3.6 m/s and a mean gradient of 32 mmHg, yet the valve looks heavily calcified. Is this truly moderate stenosis, or has the Doppler underestimated it?[1], [2]
Why velocity is underestimated
Continuous-wave Doppler measures the velocity component along the beam, so any angle between beam and jet lowers the recorded velocity and gradient. Clavel and colleagues note that misalignment of the beam with flow results in an underestimation of the gradient and an overestimation of valve area, and that the apical window revealed the maximum velocity in only 40% of patients, whereas the right parasternal window did so in up to 50%.[1] Delgado and colleagues add that the more acute the aortic root angulation, the more likely a nonapical window will give the highest velocity; using only apical windows misclassified 8% from high- to low-gradient severe stenosis and another 15% from severe to moderate.[2]
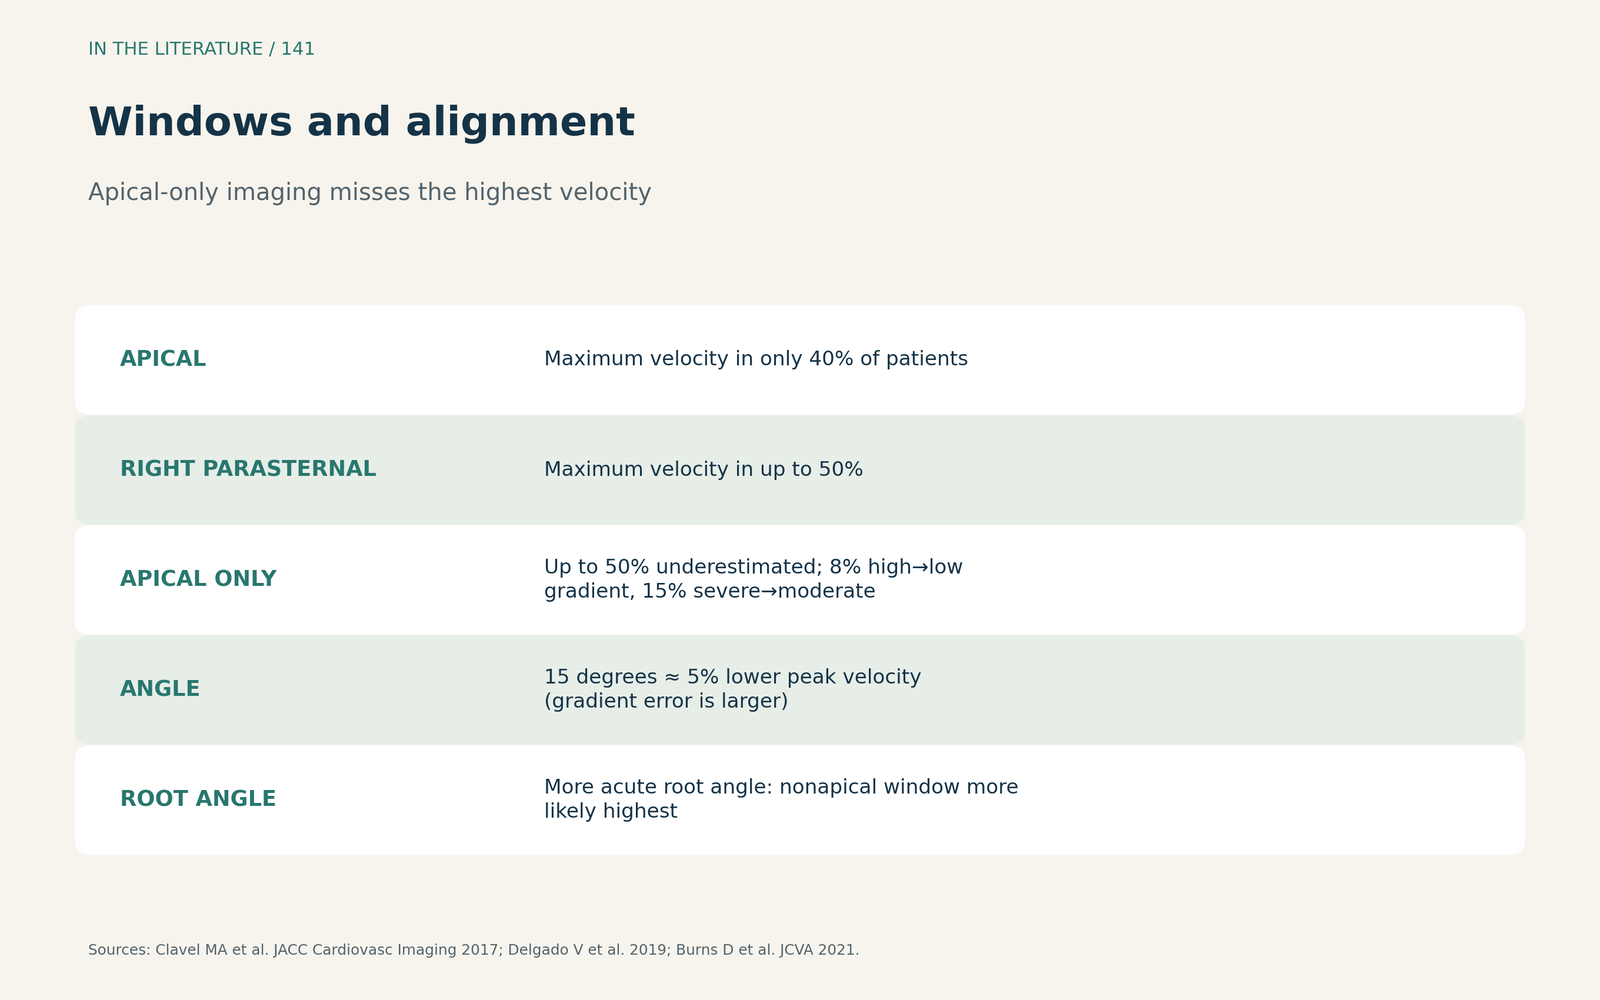
Figure 1. Windows and alignment. Synthesized from Clavel et al., Delgado et al. and Burns et al.[1], [2], [6] View larger.

What the guidelines ask for
The EACVI/ASE focused update recommends recording continuous-wave Doppler from several windows, reporting the highest velocity, and averaging at least 3 beats in sinus rhythm and at least 5 in irregular rhythm.[3] Hagendorff and colleagues stress that accurate recording involves all acoustic windows, that the apical window is often insufficient when the jet is eccentric, and that too oblique a Doppler angulation underestimates severity.[4]
Rhythm and loading
Alkurashi and colleagues found that the mean gradient was lower in atrial fibrillation than in sinus rhythm despite similarly small valve areas and normal ejection fraction, consistent with underestimation of severity during atrial fibrillation; some patients classify as low-gradient in atrial fibrillation and as high-gradient after cardioversion.[5]
Burns and colleagues compared preoperative transthoracic and intraoperative transesophageal studies in 199 patients having valve replacement. Under anesthesia, peak velocity fell from 4.51 to 3.97 m/s and mean gradient from 51 to 38 mmHg, whereas the ratio of acceleration to ejection time and the dimensionless velocity index were preserved; the authors note that a diagnosis should not rest on any single parameter.[6]
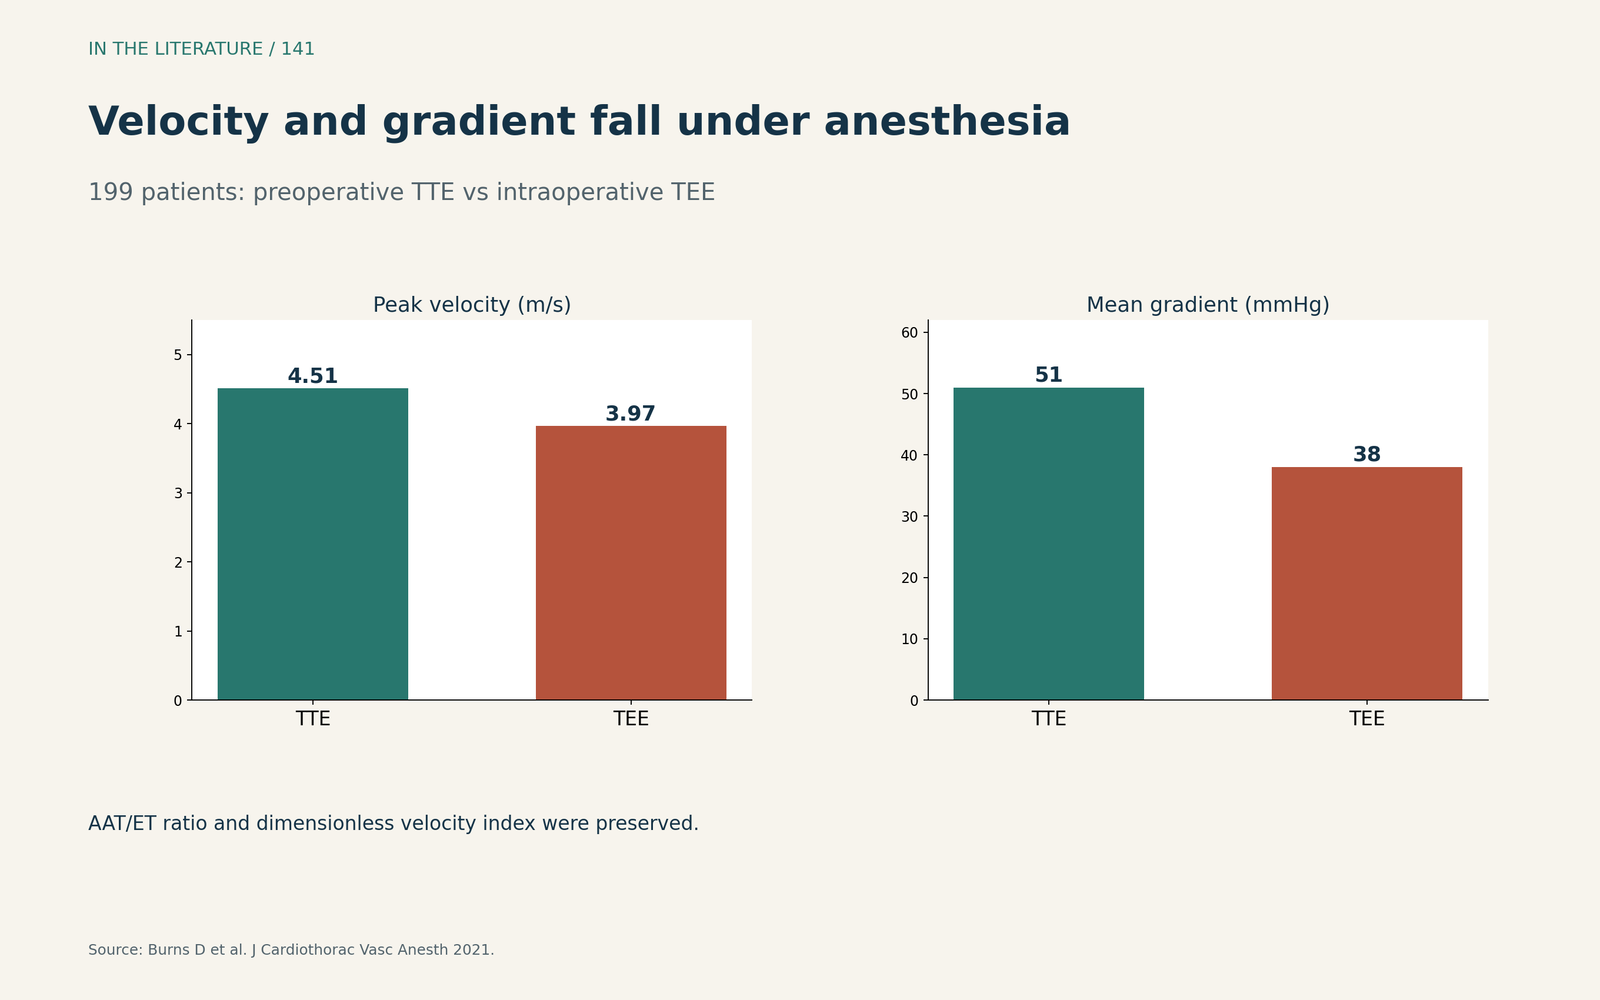
Figure 2. Velocity and gradient fall under anesthesia. Redrawn from Burns et al.[6] View larger.

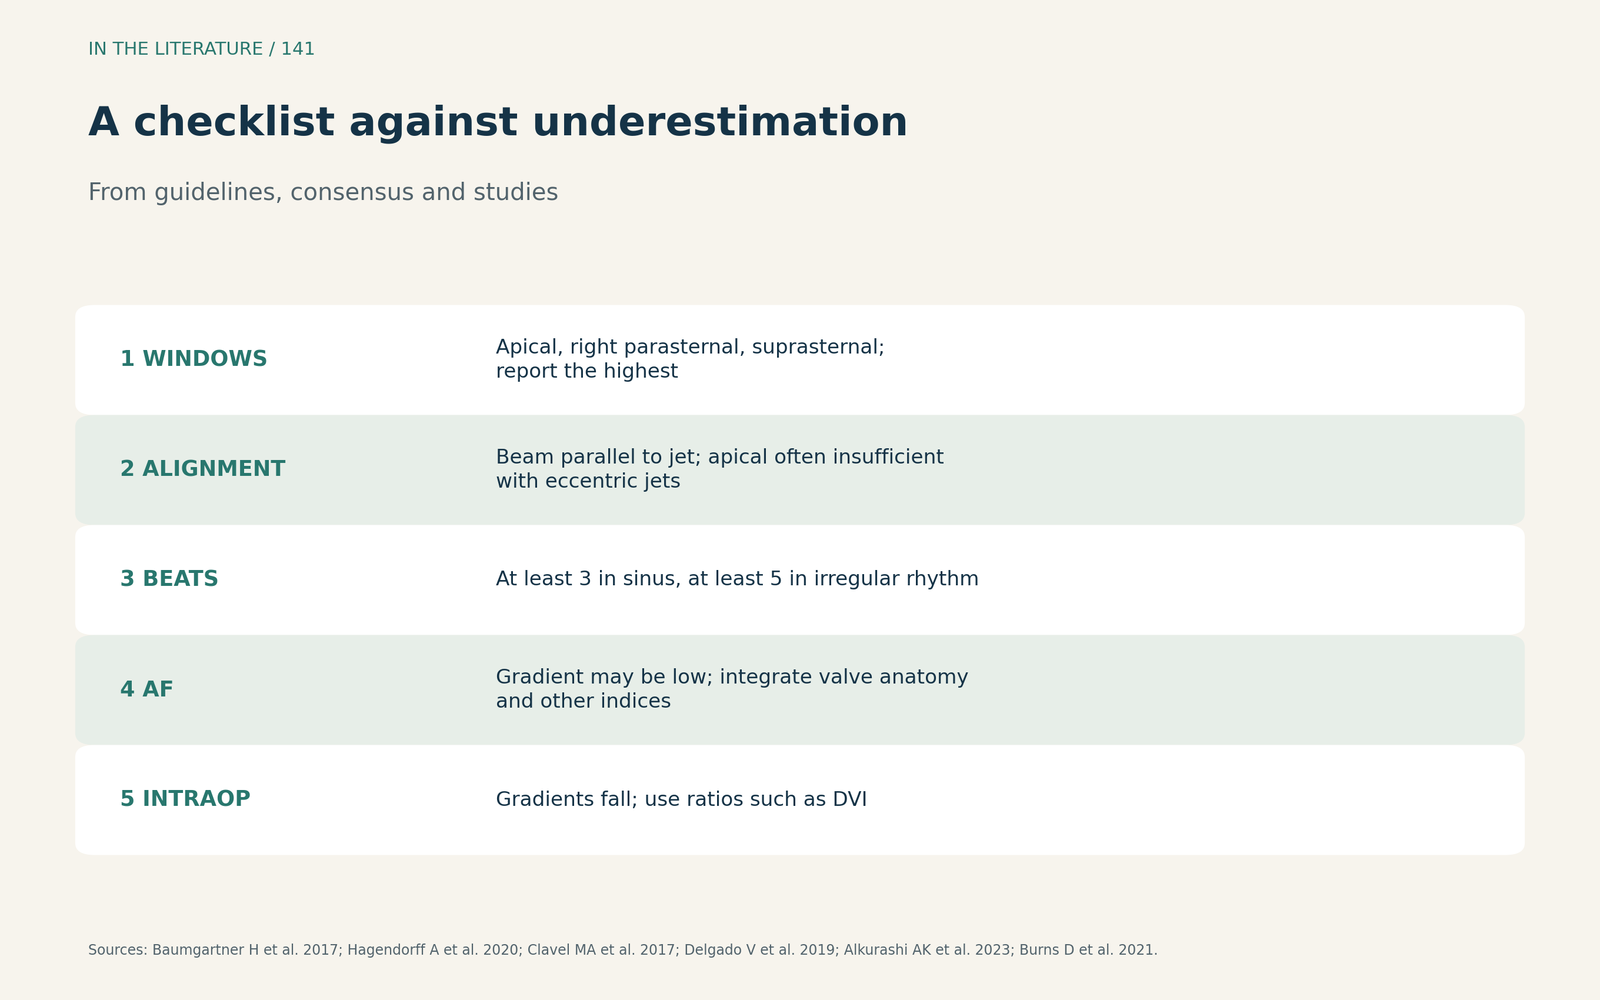
Figure 3. A checklist against underestimation. Synthesized from the EACVI/ASE update, Hagendorff et al., Clavel et al., Delgado et al., Alkurashi et al. and Burns et al.[3], [4], [1], [2], [5], [6] View larger.

Three takeaways
- Use every window. Apical alone misses the highest velocity in many patients.[1], [2], [3]
- Respect rhythm. Average enough beats and remember that atrial fibrillation lowers the gradient.[3], [5]
- Intraoperatively, trust ratios over gradients. Anesthesia and TEE windows lower velocities; flow-independent indices are more stable.[6]
References
- Clavel MA, Burwash IG, Pibarot P. Cardiac imaging for assessing low-gradient severe aortic stenosis. JACC Cardiovasc Imaging. 2017;10(2):185–202. doi:10.1016/j.jcmg.2017.01.002
- Delgado V, Clavel MA, Hahn RT, et al. How do we reconcile echocardiography, computed tomography, and hybrid imaging in assessing discordant grading of aortic stenosis severity? JACC Cardiovasc Imaging. 2019;12(2):267–282. doi:10.1016/j.jcmg.2018.11.027
- Baumgartner H, Hung J, Bermejo J, et al. Recommendations on the echocardiographic assessment of aortic valve stenosis: a focused update from the European Association of Cardiovascular Imaging and the American Society of Echocardiography. J Am Soc Echocardiogr. 2017;30(4):372–392. doi:10.1016/j.echo.2017.02.009
- Hagendorff A, Knebel F, Helfen A, et al. Expert consensus document on the assessment of the severity of aortic valve stenosis by echocardiography to provide diagnostic conclusiveness by standardized verifiable documentation. Clin Res Cardiol. 2020;109(3):271–288. doi:10.1007/s00392-019-01539-2
- Alkurashi AK, Thaden JJ, Naser JA, et al. Underestimation of aortic stenosis severity by Doppler mean gradient during atrial fibrillation: insights from aortic valve weight. J Am Soc Echocardiogr. 2023;36(1):53–59. doi:10.1016/j.echo.2022.10.007
- Burns D, Kluger R, Uda Y, Cowie B. Aortic acceleration time and the intraoperative assessment of aortic stenosis. J Cardiothorac Vasc Anesth. 2021;35(3):820–825. doi:10.1053/j.jvca.2020.10.048