ITL-be9eb3309c5a
Juan Li, MD · Updated November 17, 2026
Watch the video
Key points
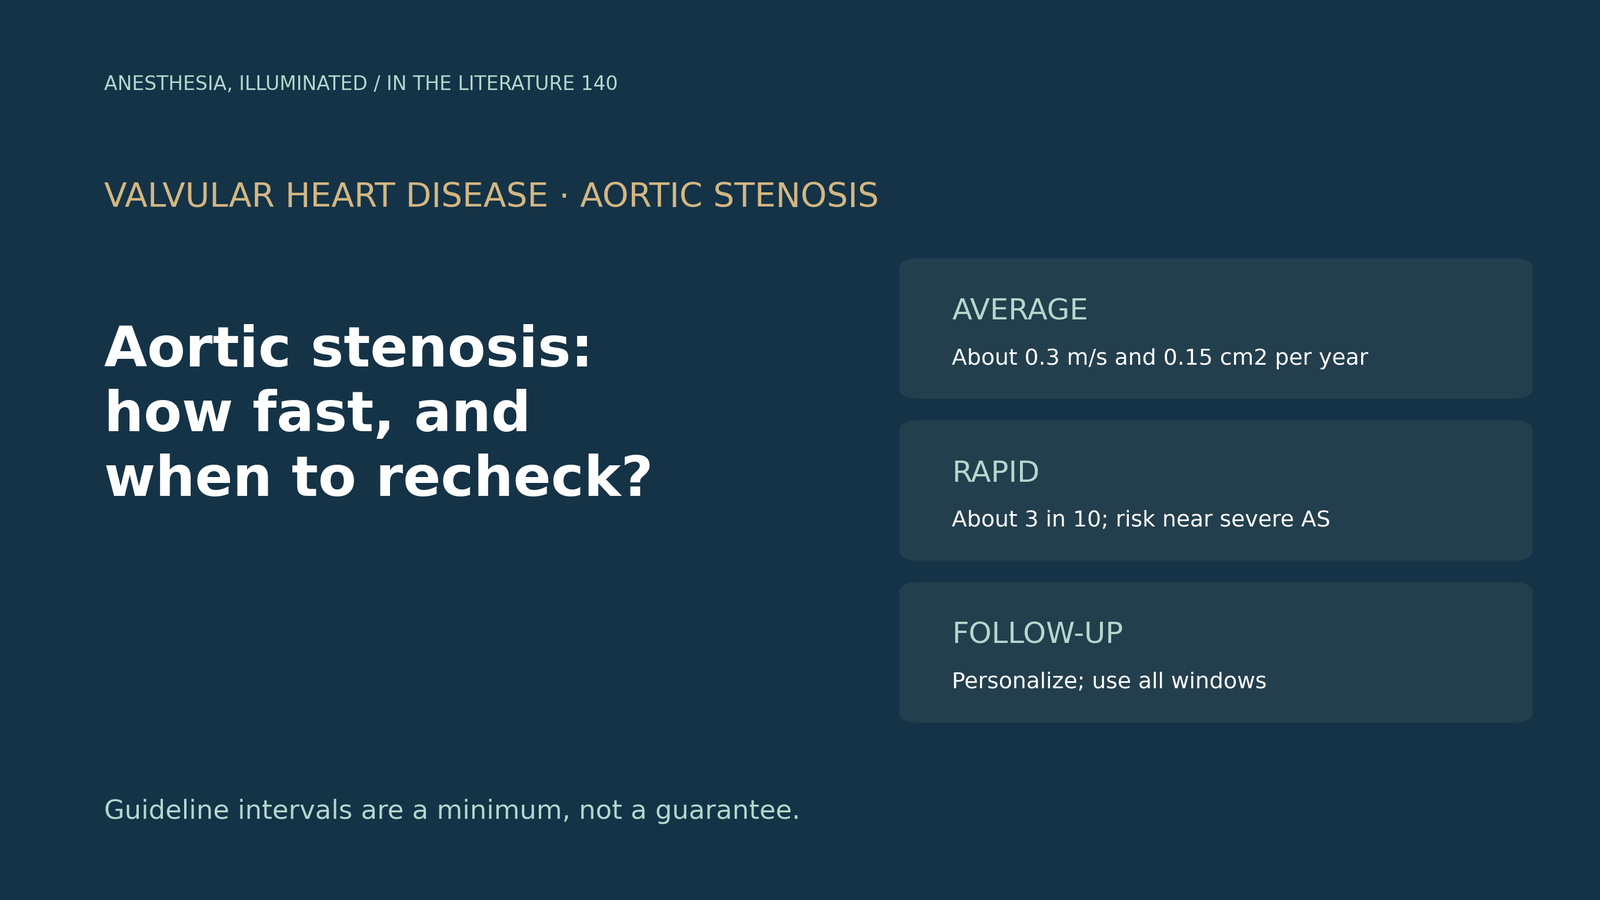
- The average is predictable; the individual is not. Peak velocity rises by about 0.3 m/s per year and valve area falls by about 0.15 cm² per year on average, but variability is wide.[1]
- Rapid progressors carry more risk. In 229 asymptomatic patients, 29% progressed by at least 0.3 m/s per year, and nonsevere rapid progressors had outcomes comparable to those with severe stenosis at baseline.[2]
- Moderate stenosis progresses too. In a recent cohort, median rates were 0.09 cm² per year for valve area, 0.17 m/s per year for velocity and 3.1 mmHg per year for mean gradient.[3]
- Simple baseline data help. In 686 patients with moderate stenosis, an initial mean gradient of 24 mmHg best identified a rapidly progressing group, and the authors argue for personalized, at least yearly follow-up.[4]
- Guidelines suggest echo every 1 to 2 years for asymptomatic moderate stenosis, yet some patients are already at high risk; follow-up should be tailored and measured with all acoustic windows.[5], [2]
Before elective noncardiac surgery, a 74-year-old has a report of moderate aortic stenosis from 2 years ago, with a peak velocity of 3.4 m/s. How much could it have progressed, and is a new echo needed?[1], [3]
How fast, on average
Otto summarizes the classic Doppler data: once valve obstruction is present, progression is inevitable and occurs over a relatively short time, with an average increase in peak velocity of about 0.3 m/s per year and a decrease in valve area of 0.15 cm² per year. Among patients with a velocity of 3 to 4 m/s, 34% develop symptomatic severe stenosis within 3 years, and above 4 m/s symptom onset within 2 years approaches 80%. There is wide variability between patients, which is why periodic clinical evaluation and echocardiography are needed in all asymptomatic patients.[1]
Venema and colleagues measured serial echocardiograms in patients with moderate stenosis and found median rates of 0.09 cm² per year for valve area, 0.17 m/s per year for peak velocity and 3.1 mmHg per year for mean gradient; their model explained only part of the variation, and they note that rates based on only 2 measurements may be under- or overestimated.[3]
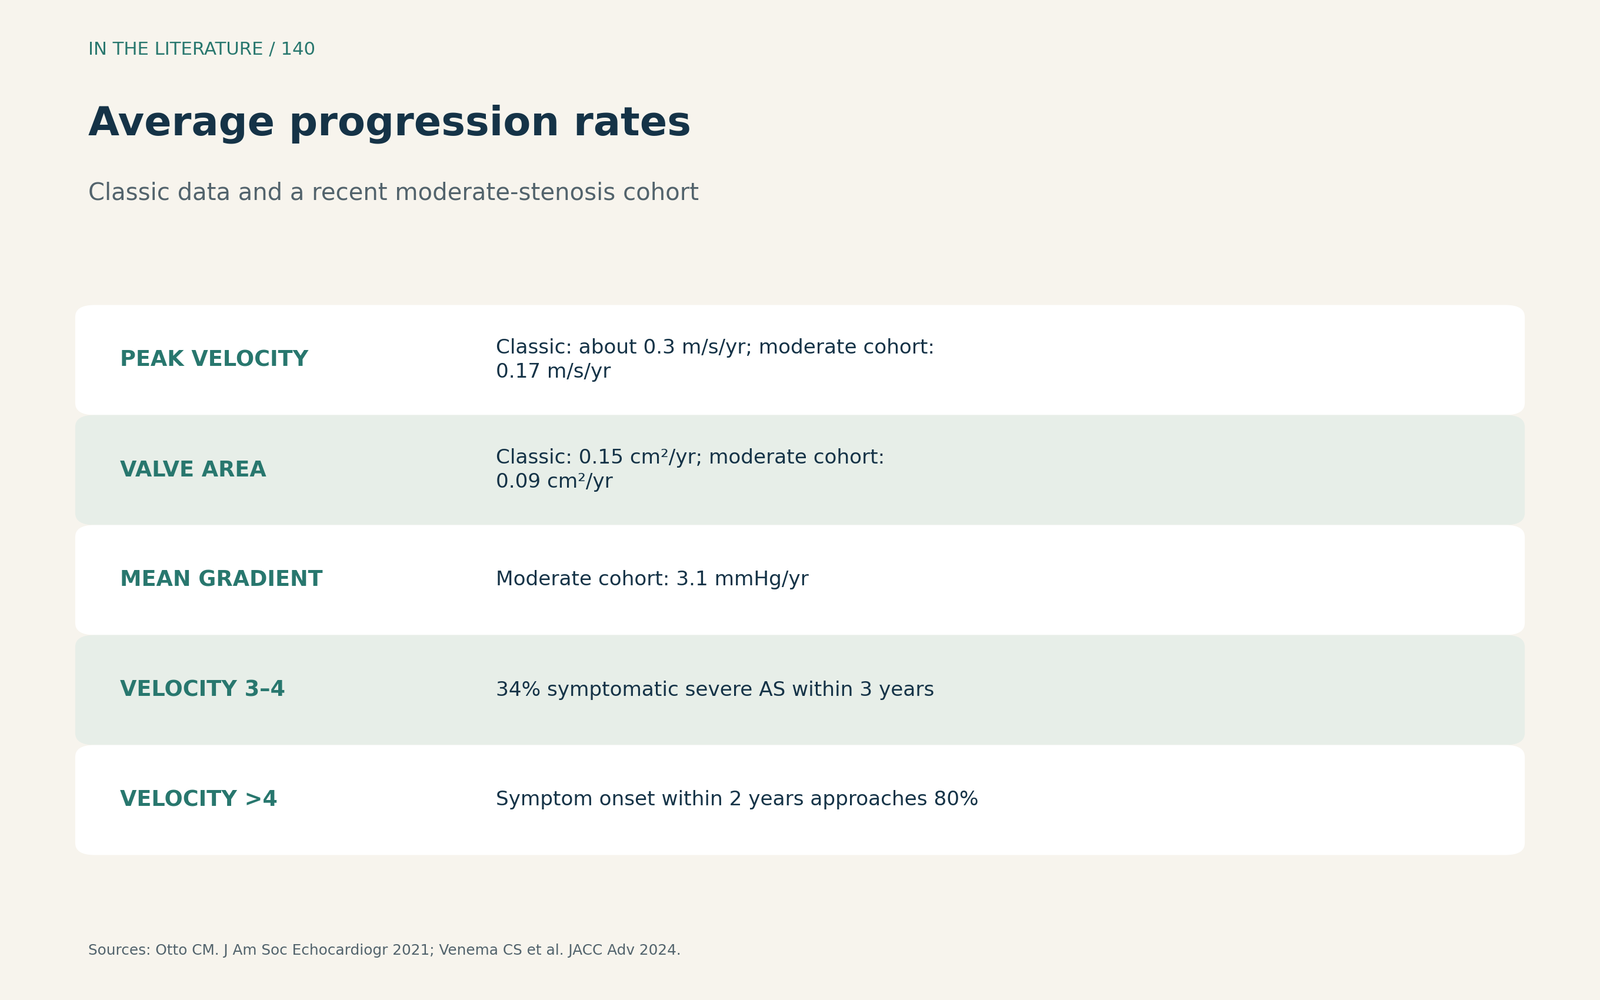
Figure 1. Average progression rates. Redrawn from Otto, Benfari et al. and Venema et al.[1], [2], [3] View larger.

Who progresses quickly
Benfari and colleagues followed 229 asymptomatic patients: progression rate was an individual, almost unpredictable feature, and 67 (29%) were rapid progressors. Rapid progression was associated with higher mortality, and nonsevere rapid progressors had outcomes comparable to patients with severe stenosis at baseline.[2] Cho and colleagues grouped 686 patients with moderate stenosis by their trajectories into slow and rapid groups; an initial mean gradient of 24 mmHg showed the highest predictive value, and age and sex were not associated with rapid progression.[4]
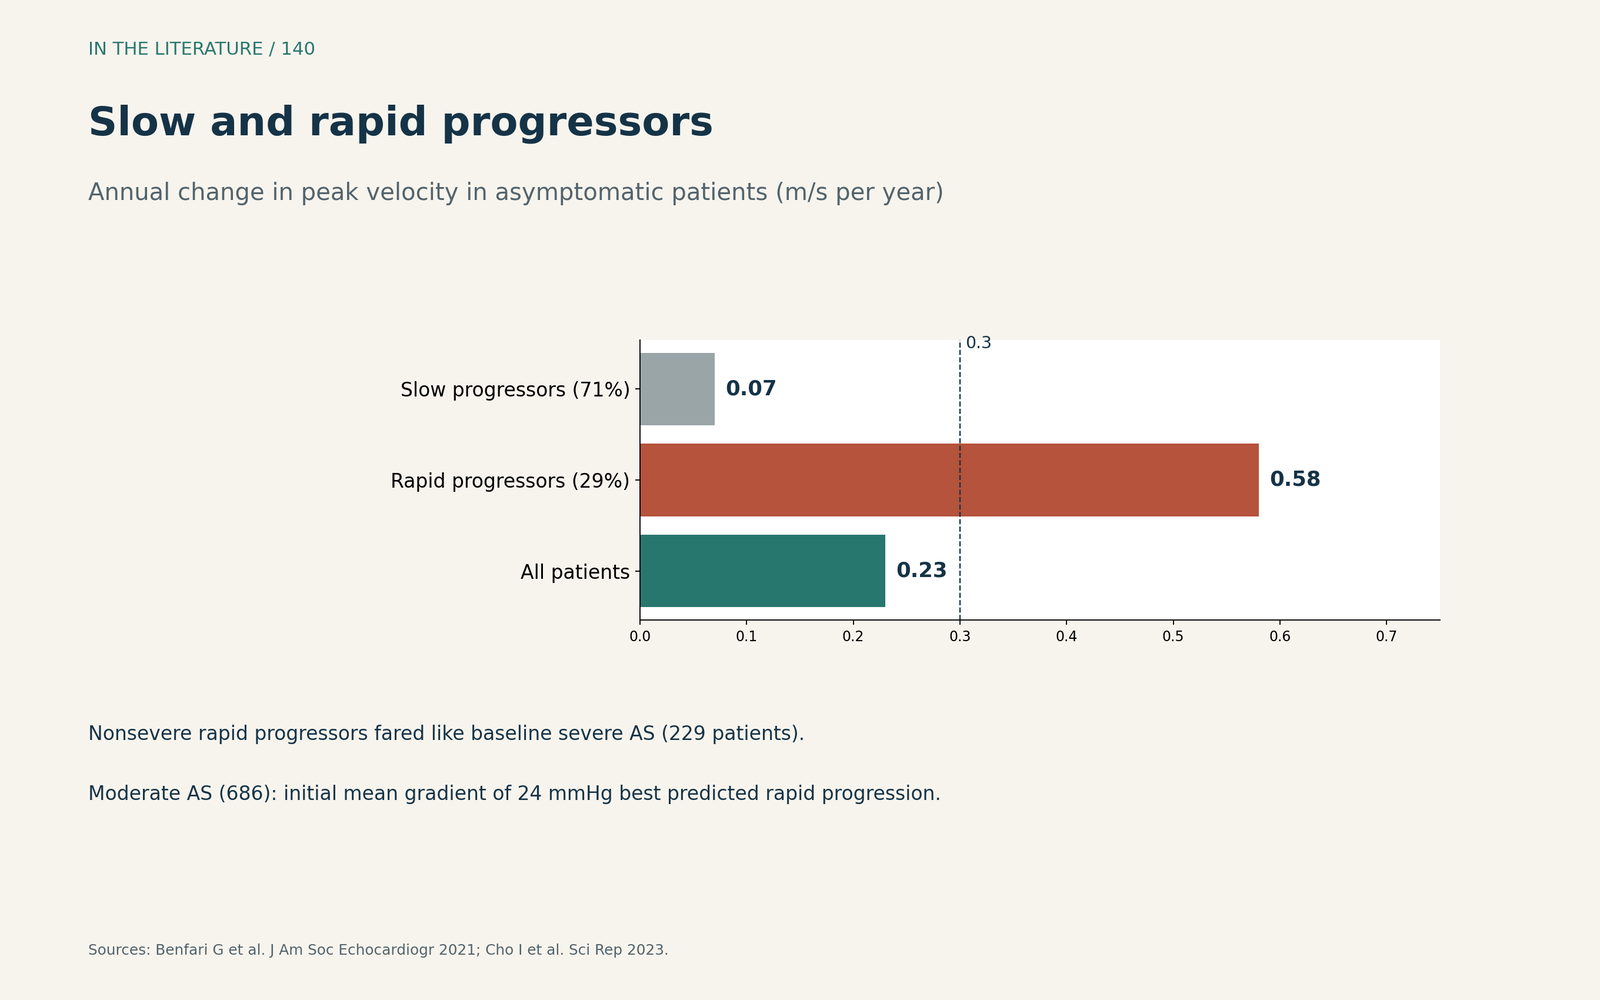
Figure 2. Slow and rapid progressors. Redrawn from Benfari et al. and Cho et al.[2], [4] View larger.

Setting the follow-up interval
Stassen and colleagues note that guidelines recommend echocardiography every 1 to 2 years for asymptomatic moderate stenosis with preserved ejection fraction, yet mortality was already 14% after 2 years when global longitudinal strain fell below 16%.[5] Venema and colleagues describe European advice of yearly follow-up for moderate and 6-monthly follow-up for severe stenosis, and conclude that patients at high risk of rapid progression should be monitored regularly.[3] Cho and colleagues argue that follow-up should be more personalized, with at least yearly examinations for rapidly progressing patients.[4] Benfari and colleagues stress that accurate guideline-based surveillance, using all acoustic windows, is crucial to detect rapid progressors.[2]
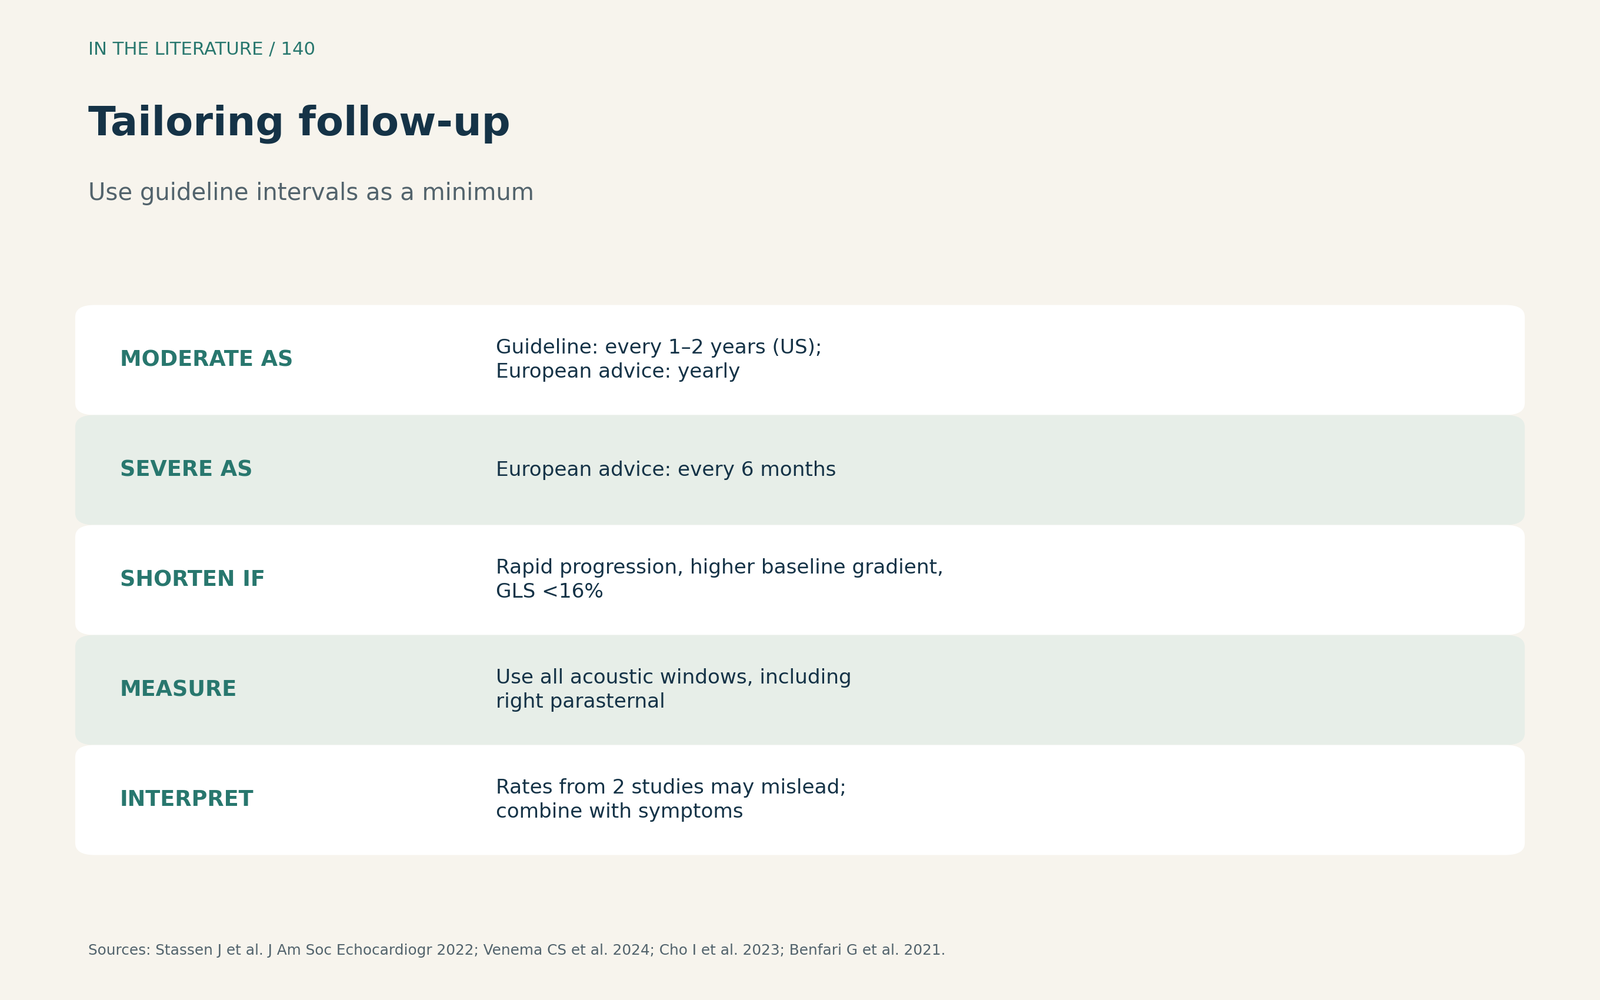
Figure 3. Tailoring follow-up. Synthesized from Stassen et al., Venema et al., Cho et al. and Benfari et al.[5], [3], [4], [2] View larger.

Three takeaways
- Expect about 0.3 m/s per year, but not for everyone. Individual rates vary widely.[1], [3]
- Find the rapid progressors. They carry risk close to severe stenosis; a higher baseline gradient is a clue.[2], [4]
- Personalize the interval. Use guideline intervals as a minimum and measure with all windows.[5], [2]
References
- Otto CM. Aortic stenosis progression: Doppler echocardiography shifted the paradigm. J Am Soc Echocardiogr. 2021;34(3):245–247. doi:10.1016/j.echo.2020.12.012
- Benfari G, Nistri S, Marin F, et al. Excess mortality associated with progression rate in asymptomatic aortic valve stenosis. J Am Soc Echocardiogr. 2021;34(3):237–244. doi:10.1016/j.echo.2020.11.015
- Venema CS, van Bergeijk KH, Hadjicharalambous D, et al. Prediction of the individual aortic stenosis progression rate and its association with clinical outcomes. JACC Adv. 2024;3(4):100879. doi:10.1016/j.jacadv.2024.100879
- Cho I, Kim WD, Kim S, et al. Reclassification of moderate aortic stenosis based on data-driven phenotyping of hemodynamic progression. Sci Rep. 2023;13(1):6694. doi:10.1038/s41598-023-33683-1
- Stassen J, Pio SM, Ewe SH, et al. Left ventricular global longitudinal strain in patients with moderate aortic stenosis. J Am Soc Echocardiogr. 2022;35(8):791–800.e4. doi:10.1016/j.echo.2022.03.008