ITL-955856bbbe50
Juan Li, MD · Updated November 17, 2026
Watch the video
Key points
- Inflate at aortic valve closure; complete deflation before the next ventricular ejection. Judge the mechanical result on the waveform, not an ECG landmark alone.[1]
- Early inflation and late deflation can increase the load against which the left ventricle ejects.[1]
- A high augmented pressure does not, by itself, prove effective unloading or increased coronary blood flow.[1]
- Check where the pressure is measured: a conventional catheter inserted from an upper-extremity artery has a different sensor relationship to the balloon.[2]
The console is running, the balloon is cycling, and the diastolic peak looks impressive. The useful bedside question is still: does inflation support diastole, and is the balloon out of the way when the ventricle ejects? This is a question about timing within each heartbeat. The decision about when to insert an IABP in the course of illness is a separate one.[1]
Start with valve events, then examine the pressure response
Inflation should coincide with aortic valve closure, represented by the dicrotic notch on a suitable arterial pressure trace. Deflation should reduce aortic pressure before the next ejection. Together, these actions aim to augment diastolic perfusion pressure and reduce left ventricular afterload.[1], [2]
The ECG provides a timing input; it is not a direct image of valve motion. Interpret it alongside the arterial and balloon-pressure traces. Arrhythmia, low ECG voltage, electrode problems and electrical interference can all impair reliable triggering. A trigger marker confirms what the controller detected, not that inflation and deflation necessarily produced the intended mechanical effect.[1]
Gillespie and colleagues describe comparing assisted with unassisted beats during a 1:2 timing assessment. This can make the notch, augmentation and subsequent end-diastolic and systolic pressures easier to compare. Because this temporarily reduces assistance, use it only when clinically tolerated and under the responsible team's supervision, then restore the prescribed support. It is a diagnostic comparison, not a recommendation to wean the patient.[1]
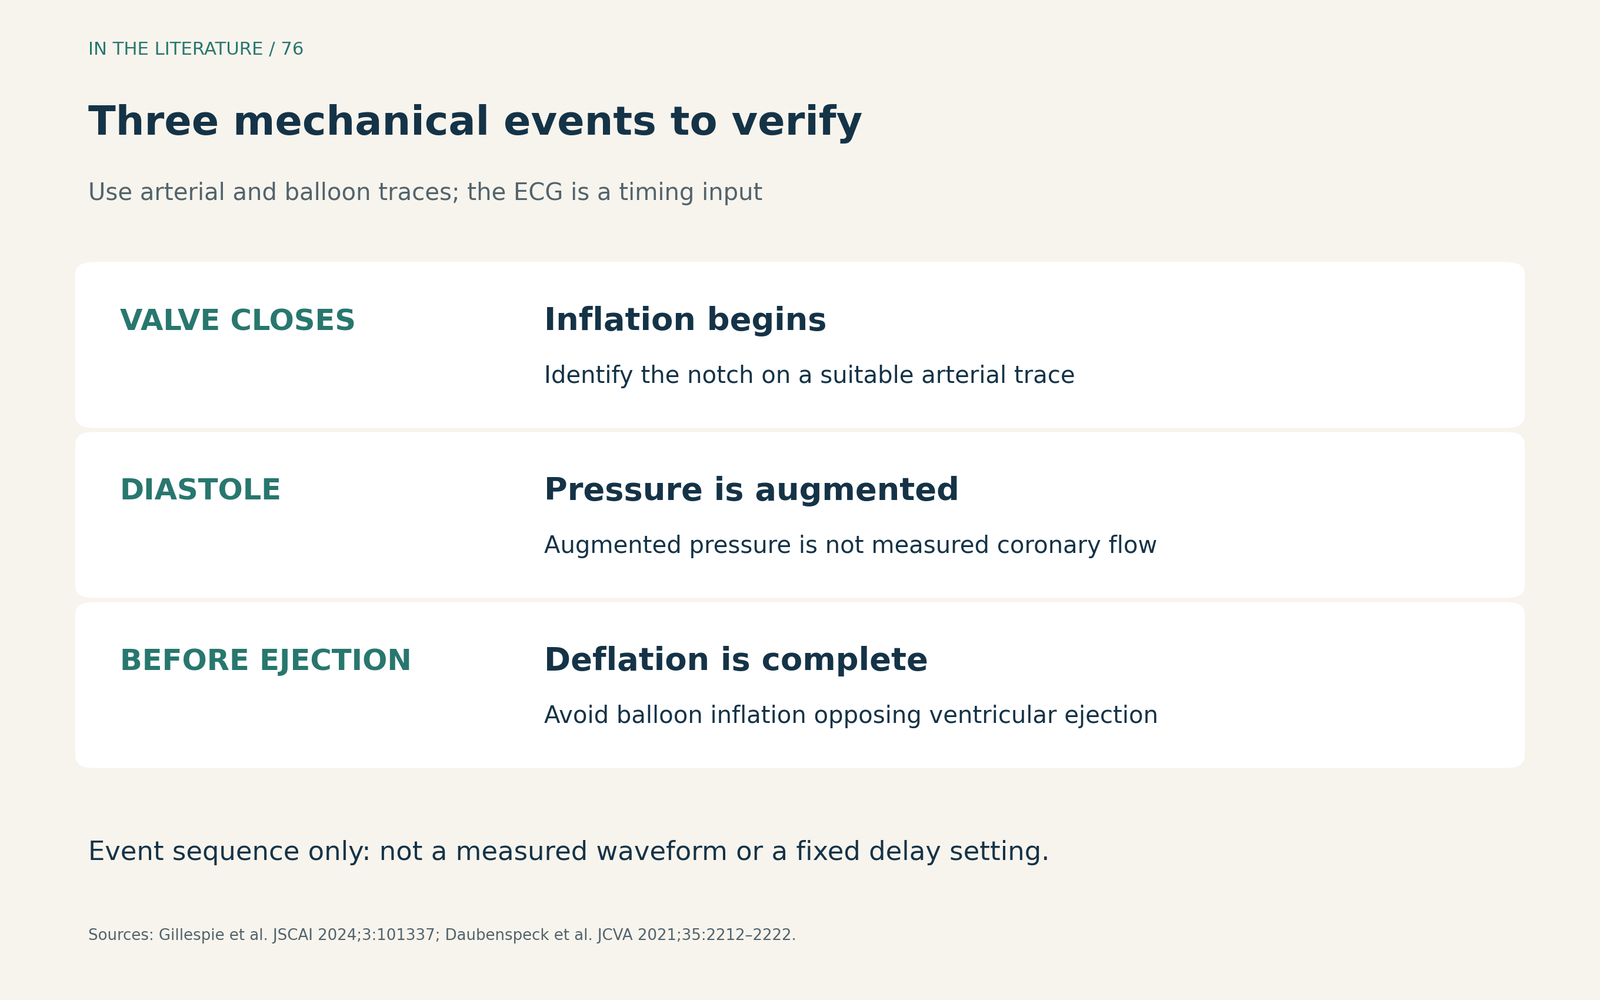
Figure 1. The sequence to verify on the actual traces. This is an event diagram, not a patient waveform or a fixed ECG-to-balloon delay. Pressure-sampling location and signal quality affect how the landmarks appear.[1], [2] View larger.

Recognize which part of the cycle is wrong
Early inflation begins before valve closure. Augmentation encroaches on the preceding systolic wave, and the expected notch-to-augmentation transition is lost. The balloon may increase afterload, close the valve prematurely and impair ventricular emptying. A taller pressure peak is not evidence that this is better support.[1]
Late inflation starts after the notch and loses part of the diastolic augmentation period. The problem is missed support during diastole, rather than resistance to ejection from an inflated balloon.[1]
Early deflation produces an abrupt pressure fall soon after the augmented peak and shortens diastolic support. It can also sacrifice the intended unloading effect before the next ejection. Late deflation, by contrast, leaves balloon inflation persisting into ejection: the augmented diastolic peak may look broad, assisted end-diastolic pressure fails to fall appropriately, and the balloon can increase rather than reduce ventricular afterload.[1]
These patterns are reasons to reassess timing, signal quality and the patient's physiology together. They are not interchangeable diagnoses made from the height of one peak. The numerical pressure differences described in teaching examples should not become universal treatment targets for every patient.[1]
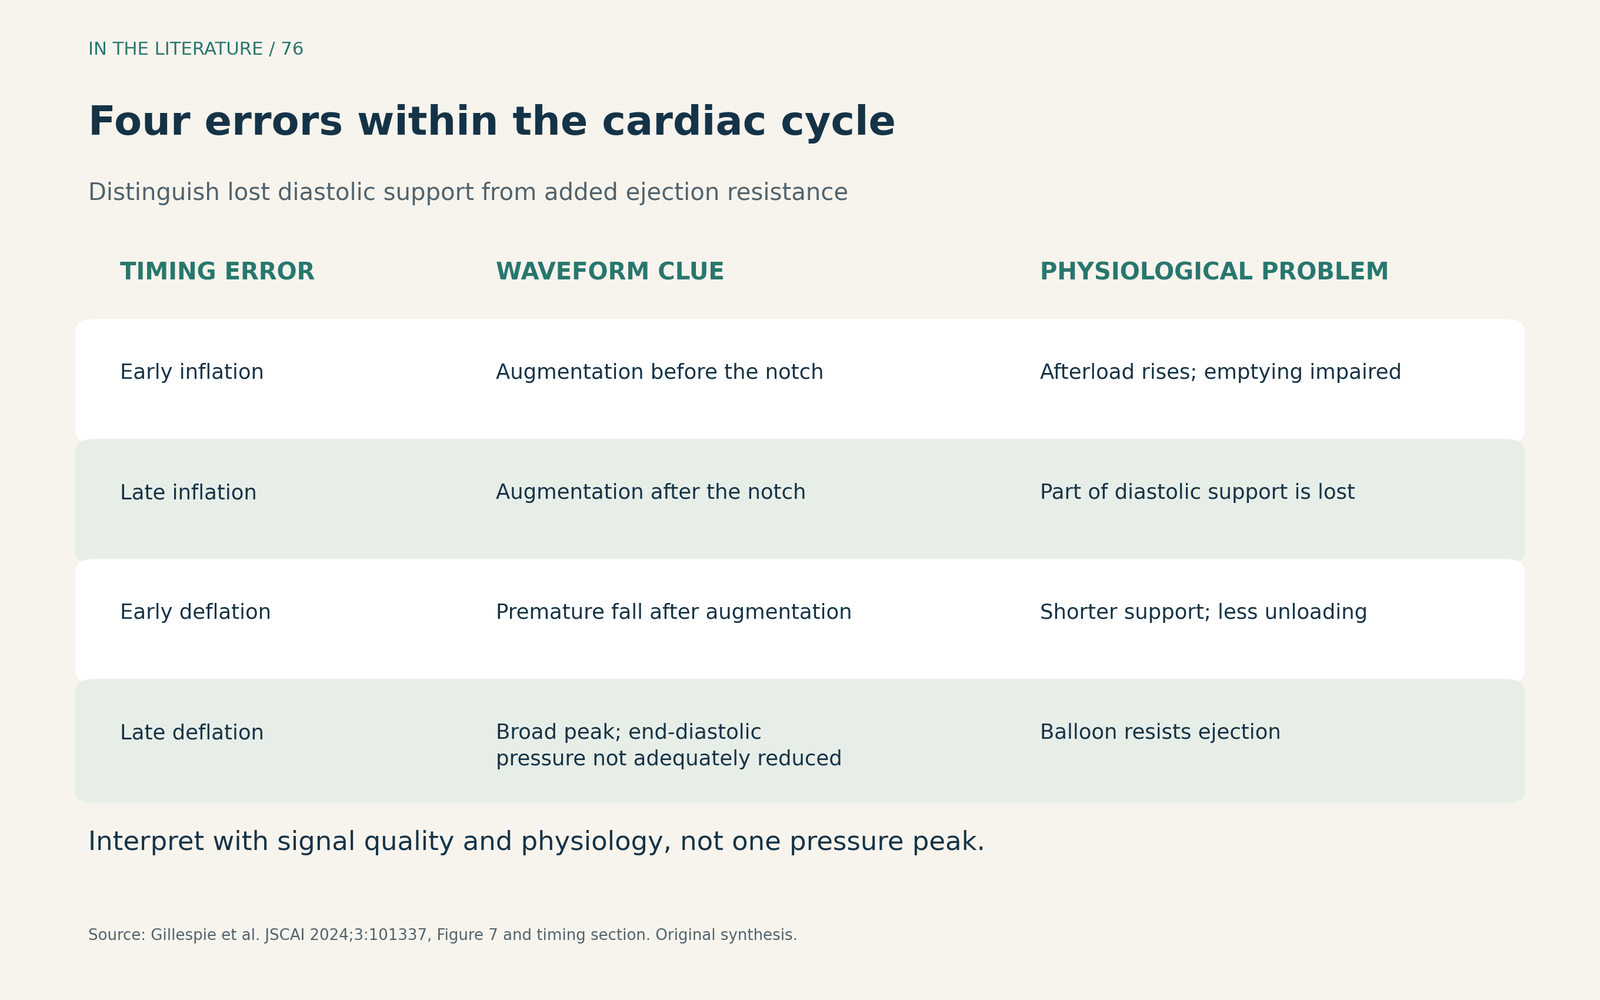
Figure 2. Four errors, two different problems: lost diastolic support or added resistance to ventricular ejection. The descriptions summarize the timing section and Figure 7 of Gillespie et al.; this table is an original teaching synthesis.[1] View larger.

Check the signal's origin before changing the timing
A pressure trace is a measurement at a particular location. In González's expert commentary accompanying Daubenspeck et al., a conventional femoral-style catheter inserted through an upper-extremity artery places its distal pressure sensor downstream of the balloon. That signal should not be assumed to represent the usual aortic-arch waveform or to be suitable for pressure triggering. This is a catheter-configuration issue, not a rule that every contemporary upper-extremity system behaves identically.[2]
The commentary describes ECG-based timing or a separate upper-extremity arterial pressure signal as alternatives, with different limitations. Arrhythmia can complicate ECG timing; a peripheral pressure signal arrives after the corresponding aortic-valve event because of pulse transmission. Before adjusting the console, establish the catheter configuration, signal source and actual waveform relationship, using the instructions for that device. There is no single millisecond correction that can be taken from this commentary.[2]
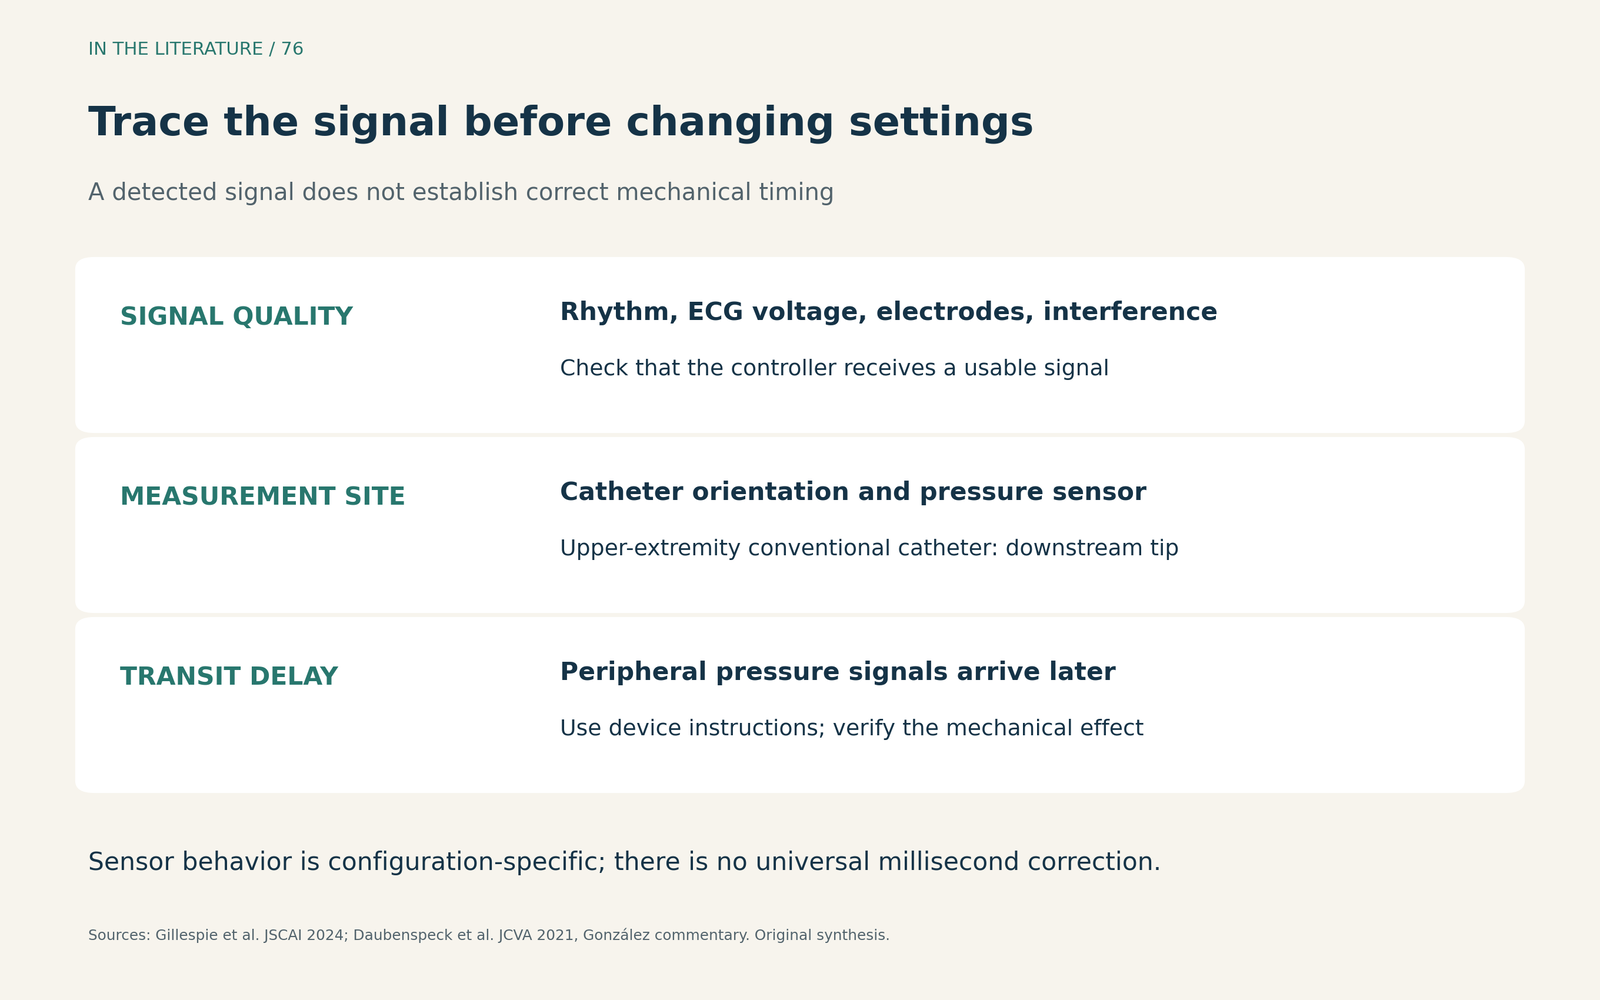
Figure 3. A signal check before a setting change. ECG quality, sensor position and pulse-transmission delay answer different questions. The final check remains the mechanical timing and pressure response, interpreted in the patient's clinical context.[1], [2] View larger.

Does a study of delayed deflation justify delaying every balloon?
Boccellino et al. studied delayed deflation using carotid ultrasound, transthoracic echocardiography and central aortic pressure analysis. Their formal published abstract reports that moving the deflation trigger to QRS onset increased cerebral blood flow by 20% and cardiac output by 15%, without prolonging the measured isovolumetric contraction and ejection phases.[3]
Those are physiological observations, not demonstrated reductions in stroke or mortality. The available abstract does not provide the sample size, allocation details or follow-up needed to judge a general timing prescription. It also acknowledges the competing risk of increased early-systolic afterload. The clinical implication is to assess the actual hemodynamic response; the study does not establish that allowing an inflated balloon to oppose ejection is beneficial or that a fixed delay is appropriate across devices and rhythms.[3]
Finally, pressure augmentation and blood flow are different quantities. Coronary vascular resistance also affects flow, so an increase in coronary perfusion pressure cannot by itself establish an increase in coronary blood flow. A visually satisfactory trace must therefore remain part of a broader assessment of support, rather than its sole endpoint.[1]
Three takeaways
- Read the sequence, not just the peak. Identify valve closure, diastolic augmentation and completion of deflation before the next ejection.[1]
- Trace the signal back to its source. Rhythm, electrode quality, catheter orientation and pressure-sampling location can change the interpretation.[1], [2]
- Individualize the adjustment and verify its effect. A physiological signal or an impressive pressure peak is not a universal timing prescription.[1], [3]
References
- Gillespie LE, Lane BH, Shaw CR, et al. The Intra-aortic Balloon Pump: A Focused Review of Physiology, Transport Logistics, Mechanics, and Complications. J Soc Cardiovasc Angiogr Interv. 2024;3(5):101337. doi:10.1016/j.jscai.2024.101337
- Daubenspeck D, González LS, Gerlach RM, et al. Unique Complications Associated With the Subclavian Intra-Aortic Balloon Pump. J Cardiothorac Vasc Anesth. 2021;35(7):2212–2222. doi:10.1053/j.jvca.2020.12.041
- Boccellino A, Sacchi S, Pazzanese V, et al. Effects of Intra-Aortic Balloon Pump delayed deflation timing on carotid blood flow and cardiac mechanics: An ultrasound and haemodynamic study. J Heart Lung Transplant. 2023;42(4):451–455. doi:10.1016/j.healun.2022.12.007 Abstract only.