ITL-6efacf9f4198
Juan Li, MD · Updated November 17, 2026
Watch the video
Key points
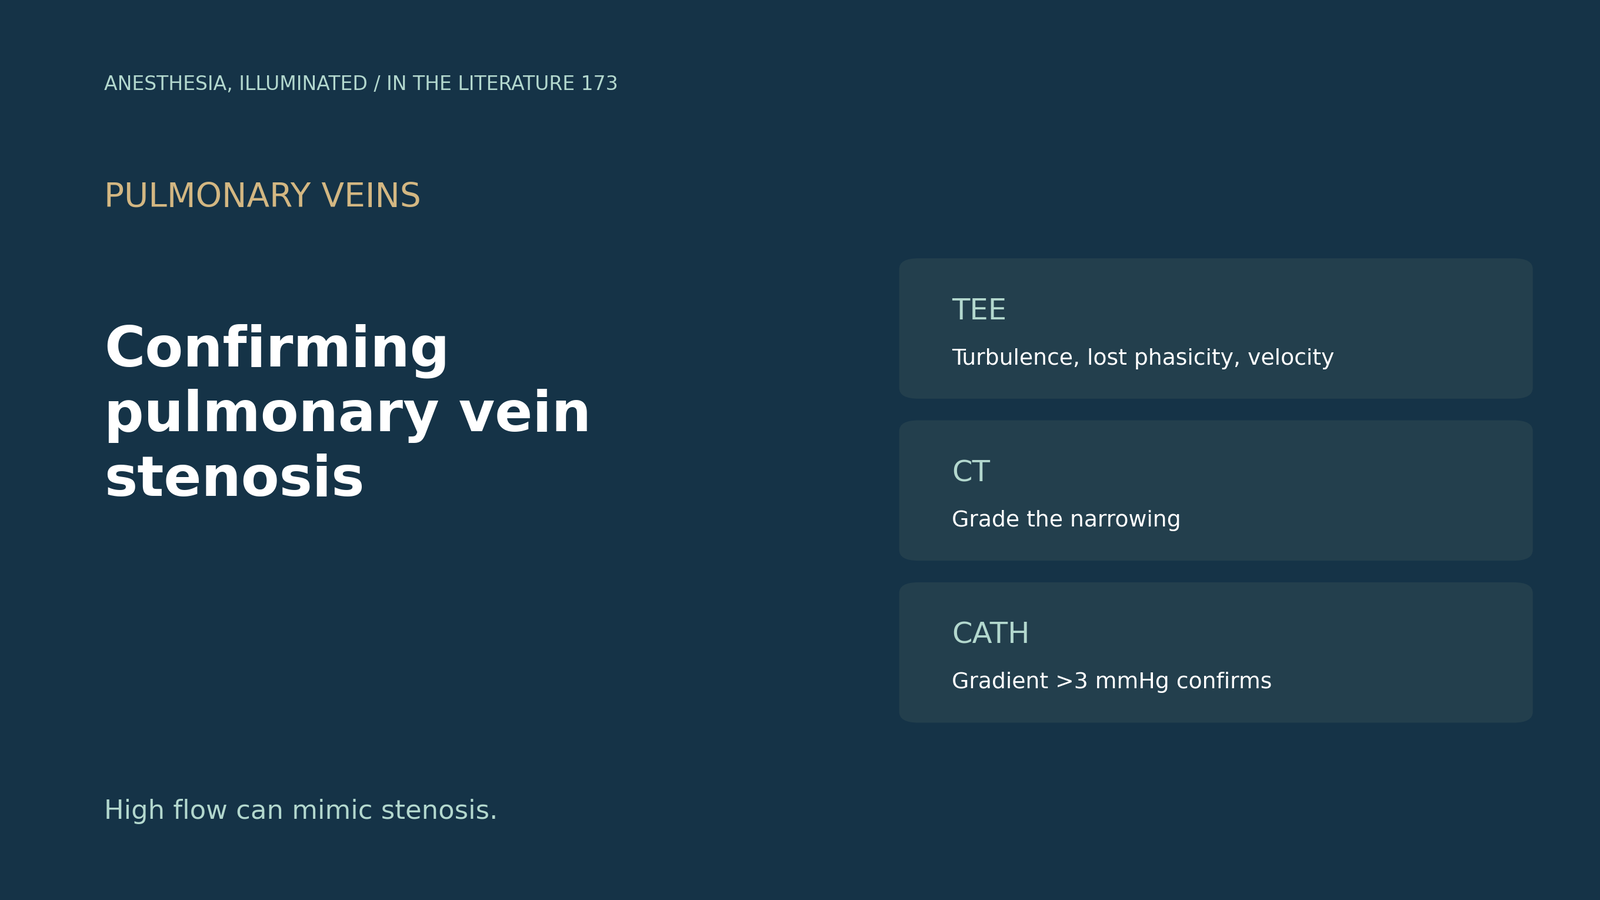
- Know the normal. Pulmonary vein peak velocity is typically 40 to 80 cm/s, and a mean gradient above 5 mmHg suggests stenosis.[1]
- Look for turbulence and lost phasicity. Turbulent ostial flow, a color mosaic and loss of phasic flow suggest significant stenosis.[2]
- Grade and confirm. CT grades narrowing (mild below 50%), and invasive catheterization is required for definitive confirmation, classically a vein-to-atrium gradient above 3 mmHg.[2]
- Beware high flow. Large left-to-right shunts increase pulmonary venous flow, so aliasing needs context, and PISA can help.[3]
- Do not skip the veins on TEE. TEE detected high velocities when contrast CT failed to show the veins, and imaging the pulmonary veins should be routine.[4]
After aortic valve replacement, a patient cannot be weaned from bypass easily, and TEE shows turbulent flow at the right upper pulmonary vein. Is this pulmonary vein stenosis, and how should it be confirmed?[1], [2]
Doppler criteria and an intraoperative example
Frogel and colleagues describe unexpected stenosis after aortic valve replacement: a vent-site suture had entrapped the posterior wall of the right upper vein, whose peak velocity was 142 cm/s, falling to 72.4 cm/s after repair. CT, TEE and catheter venography are the diagnostic studies of choice; typical pulmonary vein peak velocity is 40 to 80 cm/s, and a mean gradient above 5 mmHg suggests stenosis.[1]
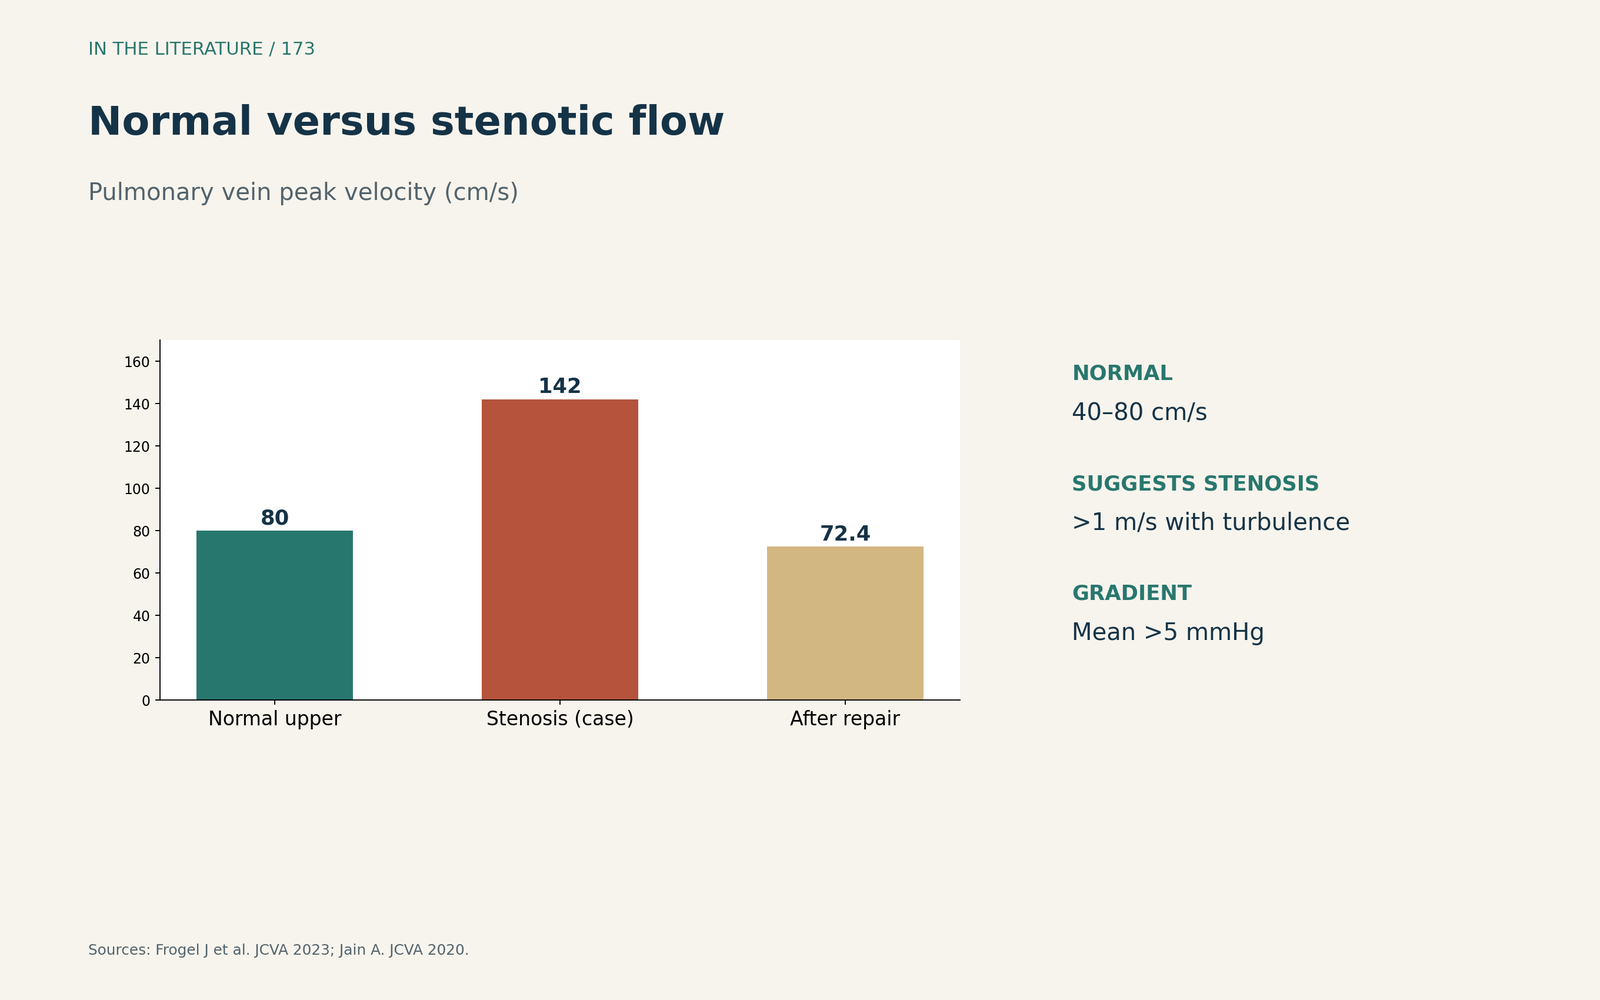
Figure 1. Normal versus stenotic flow. Synthesized from Frogel et al. and Jain.[1], [4] View larger.

A step-by-step TEE and imaging approach
Locorotondo and colleagues note that turbulent ostial flow, a color mosaic across the narrowed segment and loss of phasic flow suggest significant stenosis. CT grades narrowing as mild below 50%, pulmonary vein anatomy differs in up to 38% of people, and invasive catheterization is required for definitive confirmation, with a vein-to-atrium gradient above 3 mmHg as the classic finding.[2]
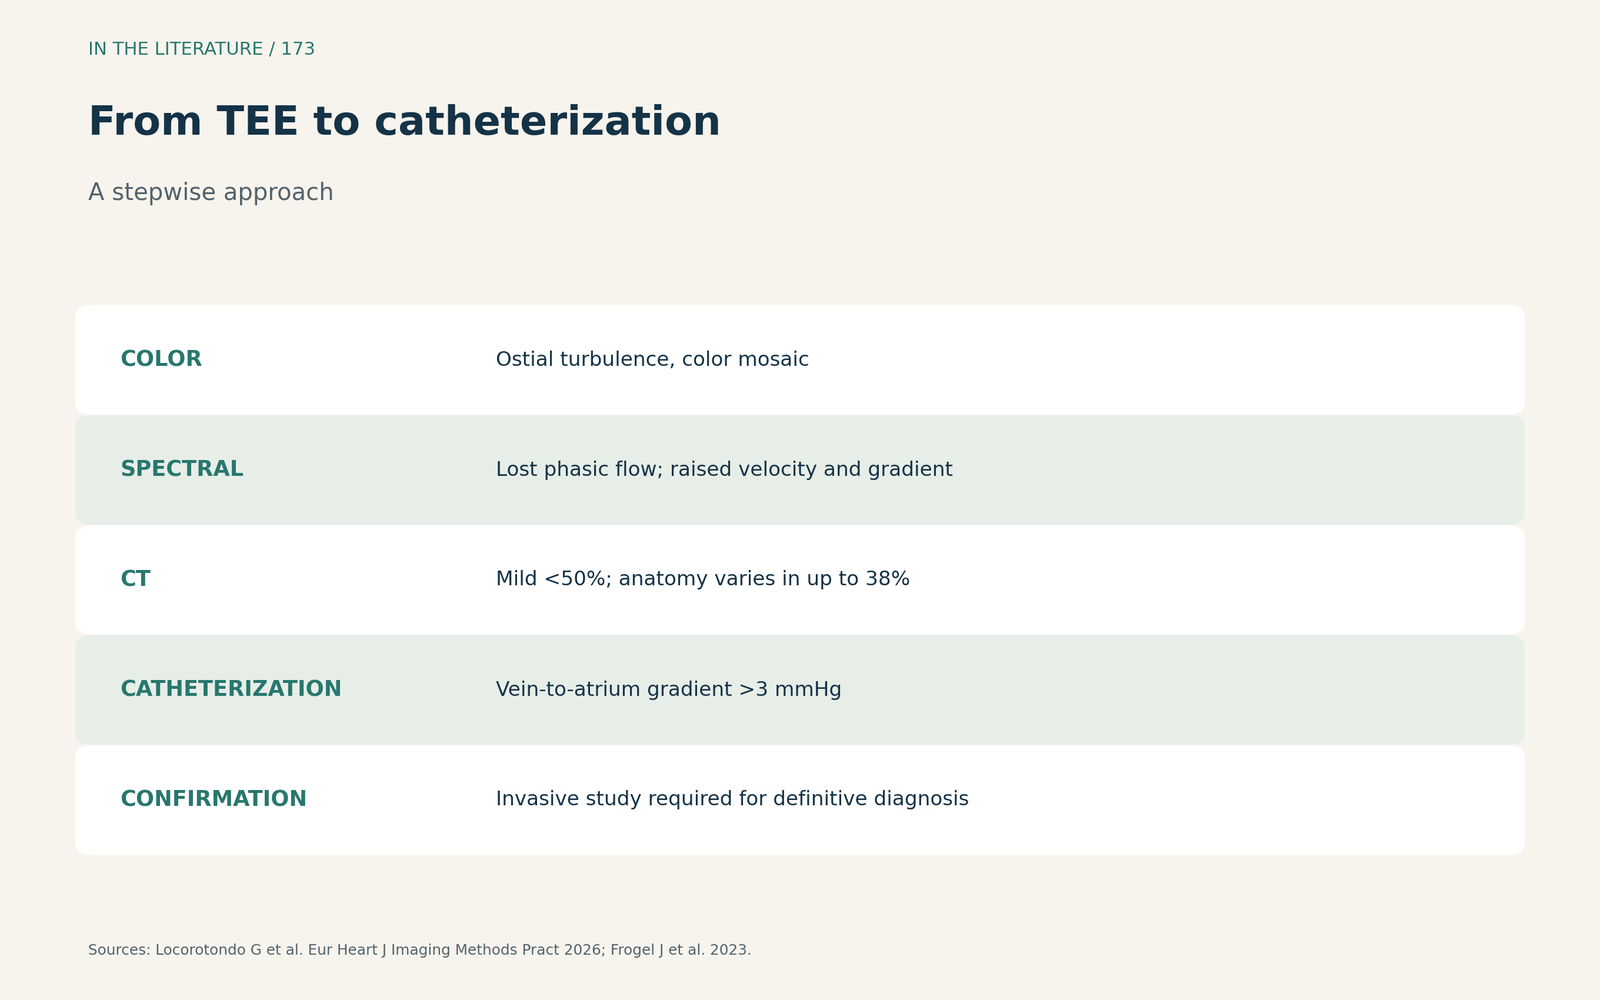
Figure 2. From TEE to catheterization. Synthesized from Locorotondo et al. and Frogel et al.[2], [1] View larger.

Pitfalls
Panidapu and colleagues point out that large left-to-right shunts increase pulmonary venous flow, so turbulence is easily attributed to flow alone; color Doppler aliasing remains an important clue, their patient had a peak velocity of 239 cm/s with a 23 mm Hg gradient, and PISA was a reliable semiquantitative method.[3] Jain describes contrast CT failing to show the pulmonary veins while intraoperative TEE diagnosed abnormally high velocities; velocity above 1 m/s with color turbulence can be used, stenosis after ablation has fallen to around 3%, TEE is available, radiation-free and low-cost, and imaging the pulmonary veins should be routine.[4]
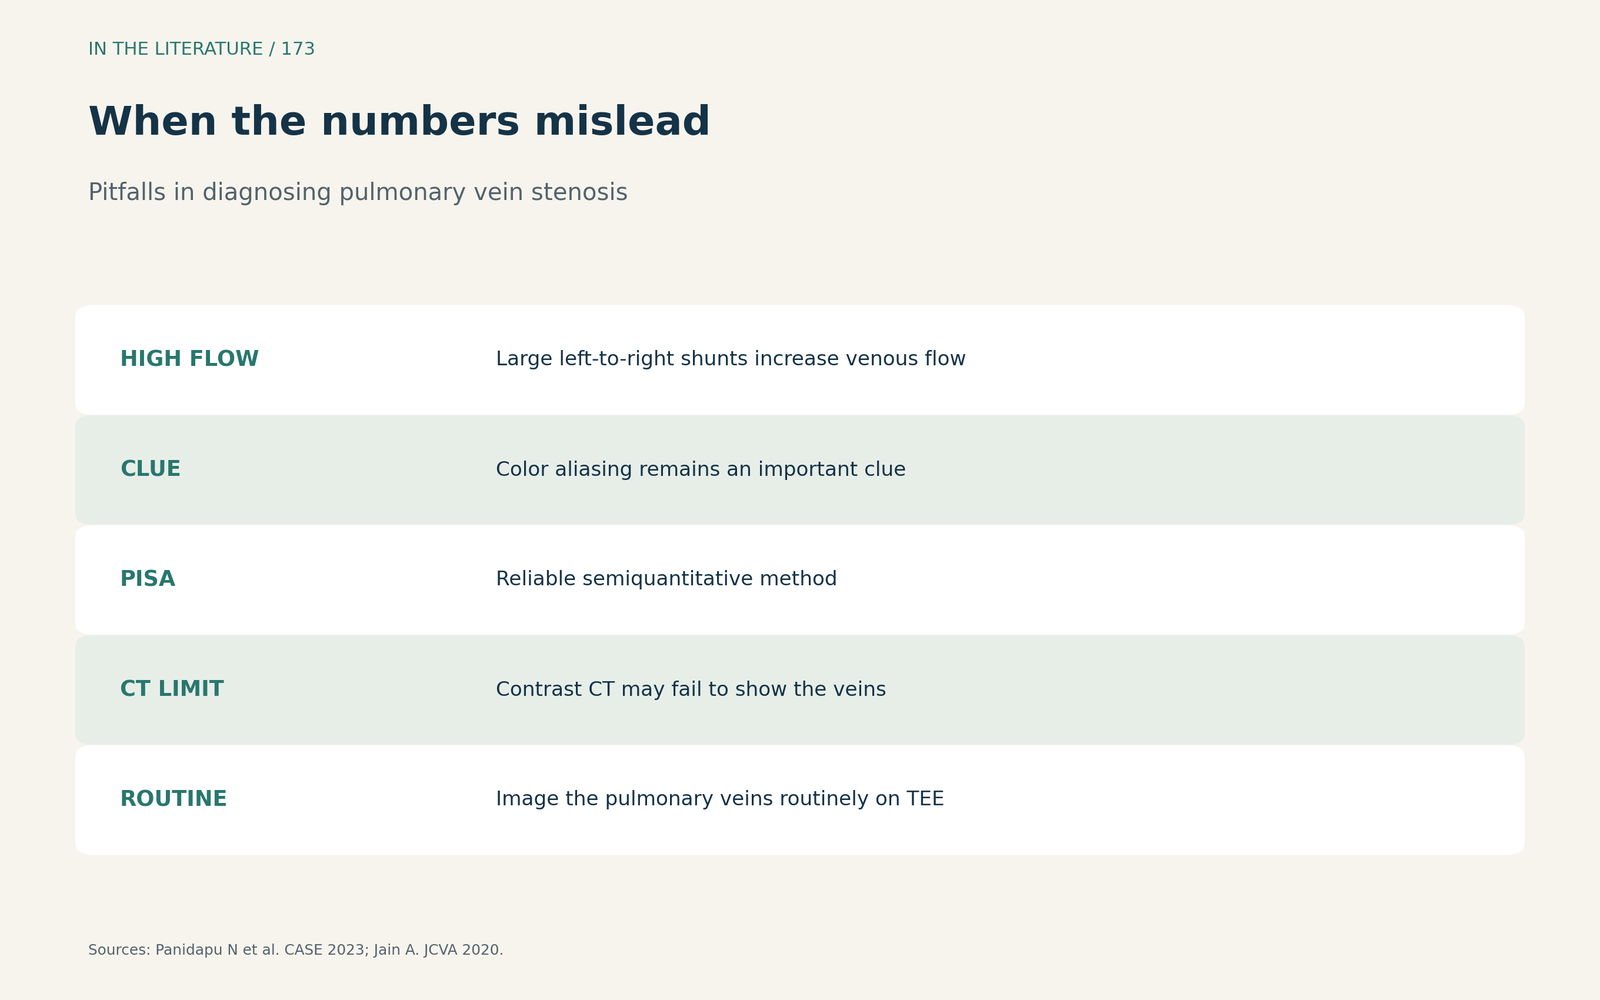
Figure 3. When the numbers mislead. Synthesized from Panidapu et al. and Jain.[3], [4] View larger.

Three takeaways
- Interrogate every pulmonary vein on TEE. Especially after cannulation, venting or ablation.[4], [1]
- Combine signs. Turbulence, lost phasicity, velocity and gradient, not one number.[2]
- Think about flow. Large shunts raise velocities; use PISA, CT or catheterization to confirm.[3], [2]
References
- Frogel J, Navon S, Astbury JC, et al. Echocardiographic diagnosis and management of unexpected pulmonary vein stenosis after aortic valve replacement. J Cardiothorac Vasc Anesth. 2023;37(1):149–157. doi:10.1053/j.jvca.2022.10.007
- Locorotondo G, Pasquini A, Pica A, et al. Percutaneous treatment of pulmonary vein stenosis: a transoesophageal echocardiography step-by-step guide in diagnosis and treatment. Eur Heart J Imaging Methods Pract. 2026;4(1):qyag083. doi:10.1093/ehjimp/qyag083
- Panidapu N, Sen B, Babu S, Gadhinglajkar SV. The complementary value of proximal isovelocity surface area in large left-to-right lesions with pulmonary vein stenosis. CASE (Phila). 2023;7(10):396–400. doi:10.1016/j.case.2023.06.004
- Jain A. Mediastinal fibrosis, pulmonary vein stenosis, and the role of transesophageal echocardiography. J Cardiothorac Vasc Anesth. 2020;34(3):835–836. doi:10.1053/j.jvca.2019.10.036