ITL-c03b64c8e63b
Watch the video
Figure 1. A high gradient is the start of an assessment, not a complete diagnosis. Conceptual artwork; not a patient image or device specification.
Key points
- Interpret the gradient alongside flow, valve type and size, leaflet appearance, and the patient's stable postoperative baseline.[1]
- Significant prosthetic stenosis requires concordant evidence from at least one flow-dependent measure and one less flow-dependent measure such as DVI or effective orifice area.[1]
- A rounded Doppler envelope, acceleration time above 100 ms and AT/ET above 0.37 strengthen concern for obstruction; they do not replace the rest of the examination.[1, 2]
- Prosthesis–patient mismatch describes an otherwise normally functioning valve whose effective opening is too small for the patient; new deterioration needs another explanation.[1]
- TEE and gated cardiac CT answer anatomical questions when Doppler and leaflet imaging do not agree; a negative CT does not exclude every important valve complication.[1, 3]
Start by asking what changed
The report says “mean aortic prosthetic gradient 32 mm Hg.” That number may reflect obstruction, a small but normally functioning prosthesis, high flow, or a measurement problem. The useful next step is to compare the present examination with the valve's identity and prior performance.
Confirm whether this is a surgical or transcatheter valve, its model and size, when it was implanted, and whether symptoms or regurgitation are new. Retrieve the baseline study obtained under stable hemodynamic conditions. A gradient that has been elevated since implantation tells a different story from a rising gradient accompanied by declining DVI and new leaflet thickening.[1]
Flow matters in both directions. High output can raise velocity through a normal prosthesis. Conversely, poor ventricular function can prevent a severely obstructed valve from generating a striking gradient. Blood pressure, heart rate, stroke volume and associated regurgitation therefore belong beside the Doppler measurements, rather than outside the interpretation.[1]
Make the measurements agree before naming stenosis
Acquire continuous-wave Doppler from the available windows and inspect the envelope. Calculate the Doppler velocity index, DVI = LVOT VTI / prosthetic valve VTI, using a correctly positioned pulsed-wave sample. A sample too close to the valve captures flow acceleration and can falsely increase DVI and calculated effective orifice area (EOA); one too far into the ventricle can falsely lower them.[1]
The 2024 ASE guideline gives useful signals for a surgical aortic prosthesis: mean gradient ≥35 mm Hg and DVI <0.25 suggest significant stenosis, interpreted together with other findings. A mean gradient of 20–34 mm Hg lies in the possible-stenosis range, not a stand-alone diagnosis. Do not transfer the surgical table wholesale to TAVR or valve-in-valve assessment, where the baseline and device configuration are particularly important.[1]
Acceleration time adds information about when peak velocity occurs. In a retrospective study of 88 patients—22 with documented stenosis, 22 with mismatch and 44 controls—an AT cutoff of 100 ms had 86% sensitivity and 86% specificity for stenosis. Half the cohort had mechanical valves. These selected groups support AT as a complementary measurement, not a universal single-test rule for every bioprosthesis.[2]
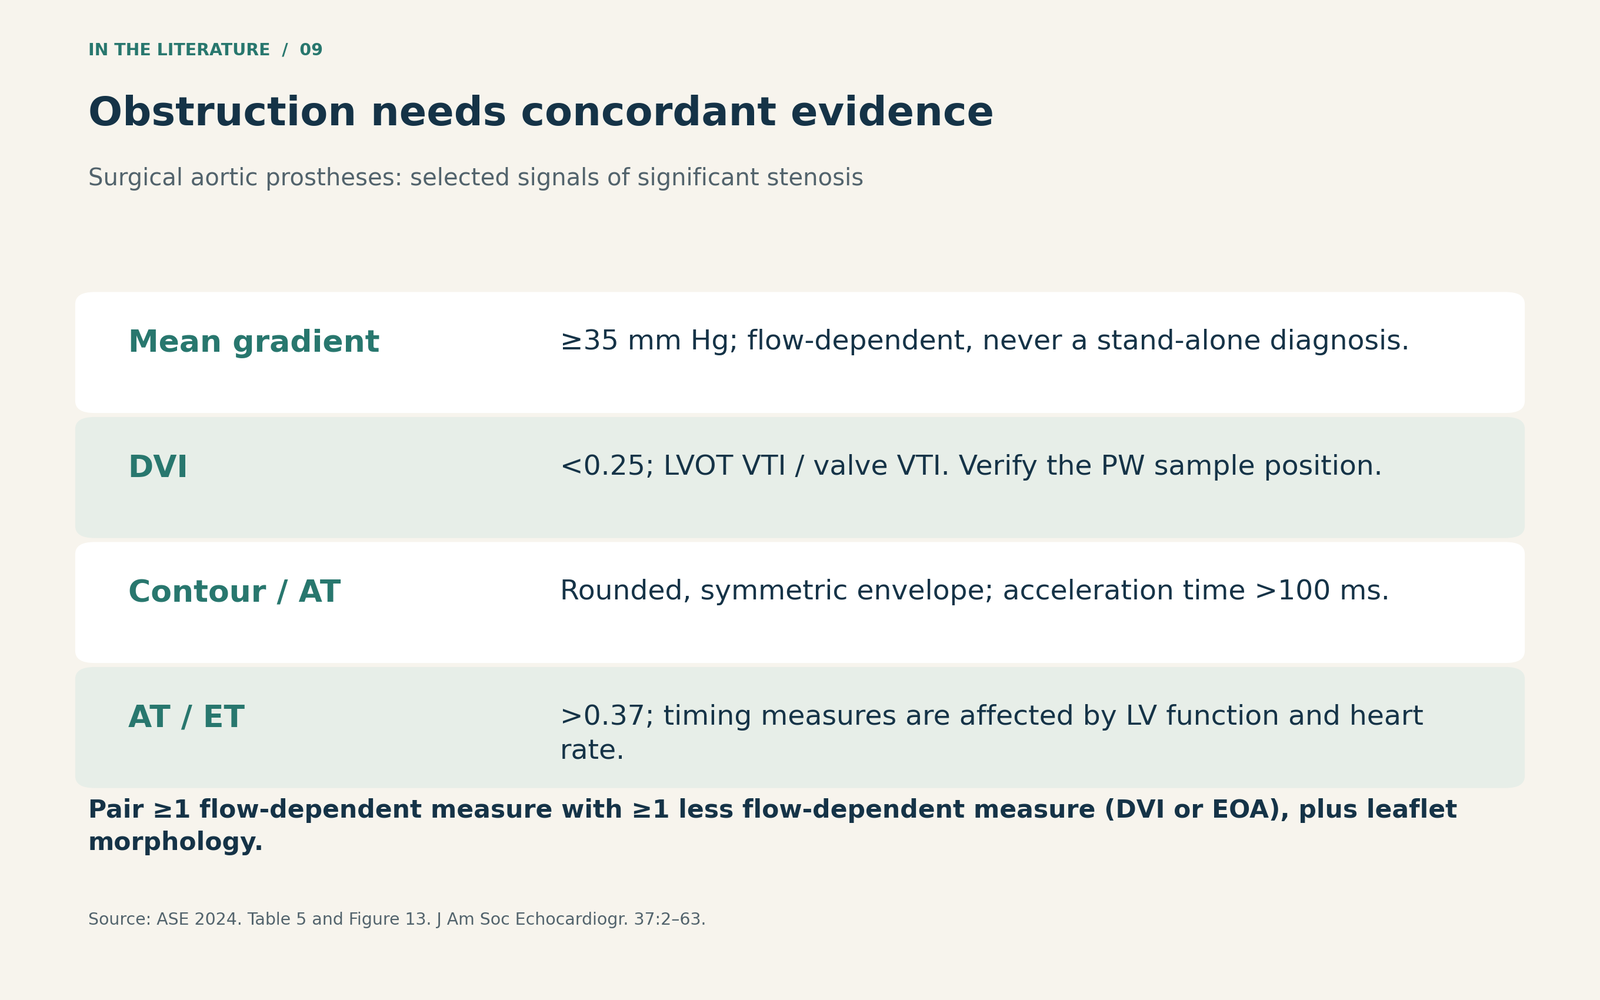
Figure 2. Selected ASE signals for significant stenosis. The mean-gradient and DVI rows refer to surgical AVR; the timing measures apply more broadly but are affected by LV function and heart rate. Concordance and morphology remain essential.[1]

Separate mismatch from a valve that has changed
In prosthesis–patient mismatch (PPM), leaflet structure and motion are normal, and the measured EOA is appropriate for the prosthesis but small relative to the patient's body size. Indexing is necessary, but obesity changes the thresholds: ASE defines severe aortic PPM as indexed EOA ≤0.65 cm²/m² when BMI is below 30 kg/m², and ≤0.55 cm²/m² when BMI is at least 30 kg/m². The guideline also requires normal structure and motion and a measured EOA within one standard deviation of the reference value.[1]
PPM and acquired dysfunction can coexist. An old label of “mismatch” should not end the evaluation of a new gradient rise or new symptoms.
For significant structural valve deterioration, the ASE hemodynamic criteria include a mean-gradient increase ≥20 mm Hg to a final mean gradient ≥30 mm Hg, accompanied by an EOA decrease ≥0.6 cm² or ≥50%, and/or a DVI decrease ≥0.2 or ≥40%, compared with the baseline assessment at 1–3 months. These criteria assume stable LV function and blood pressure, and require adverse morphological change. A gradient rise alone does not establish degeneration or distinguish it from thrombosis.[1]
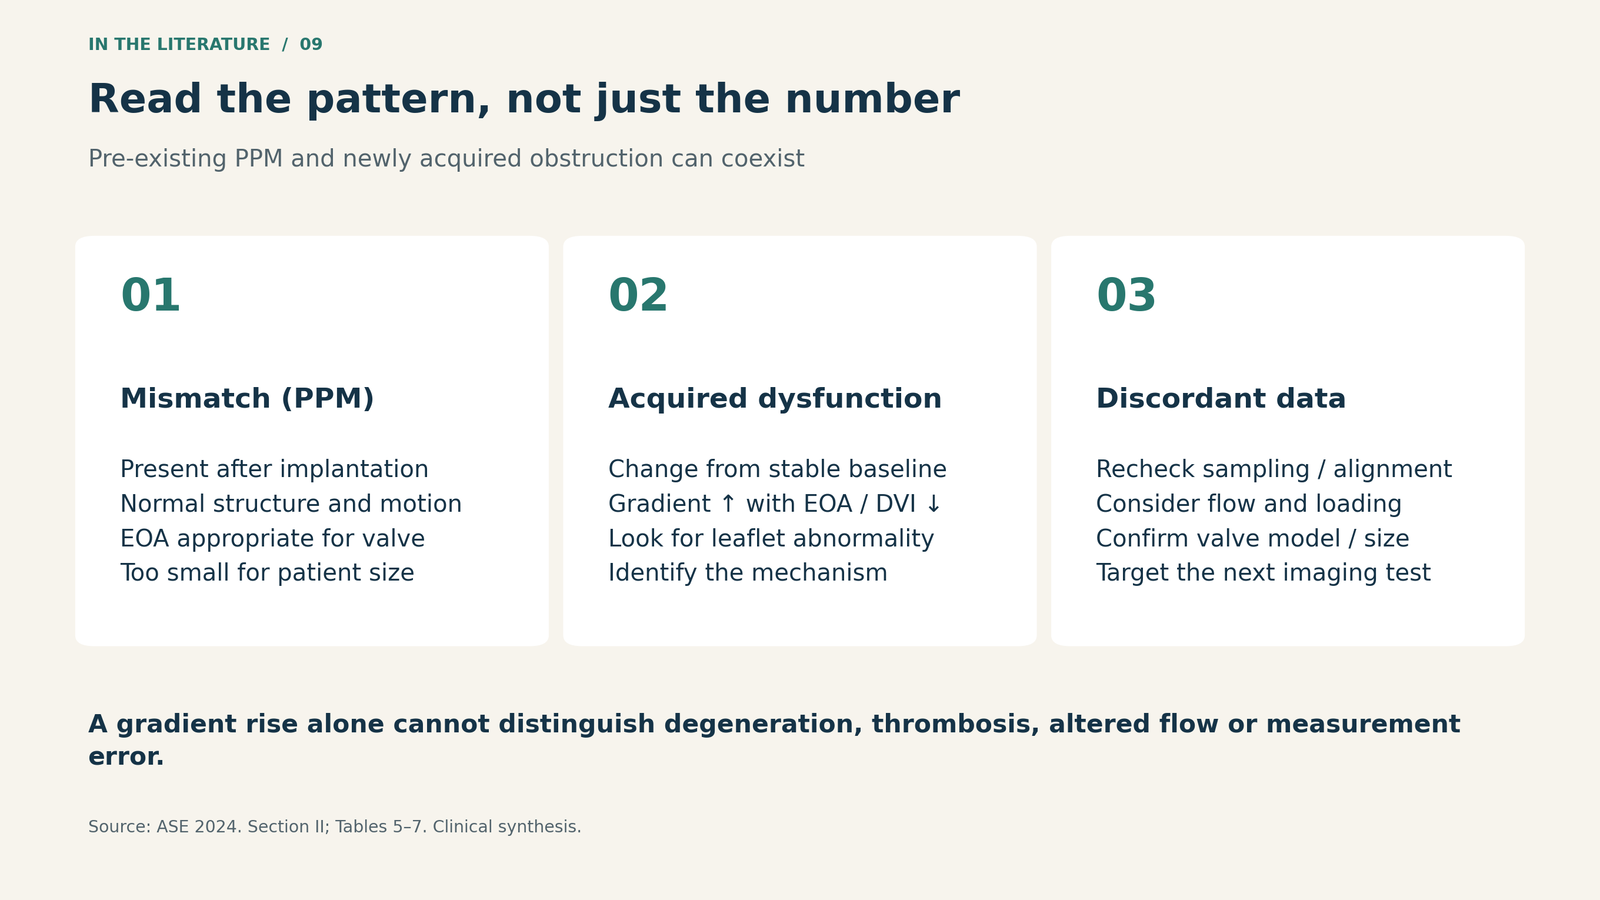
Figure 3. Follow the pattern across time. PPM can coexist with later obstruction; a previous diagnosis does not explain every subsequent change.[1]

Use another modality to resolve a specific uncertainty
TEE can clarify leaflet motion, regurgitation and associated pathology, although prosthetic shadowing still creates blind spots. CT can identify calcification, pannus, thrombus and hypoattenuated leaflet thickening with or without restricted motion. The purpose is to explain the abnormal hemodynamics and define the mechanism, not simply to collect another image.[1]
A 2026 retrospective CT study illustrates both value and boundaries. Of 64 patients referred for suspected prosthetic dysfunction, 44 had mechanical valves, 12 surgical bioprostheses and eight transcatheter valves. Among 34 patients with negative CT findings, two developed the study's device-related endpoint within one year, giving a reported negative predictive value of 94%. Both had endocarditis-related abnormalities confirmed at surgery within five months.[3]
That 94% is an event-based result in a selected, predominantly mechanical-valve cohort; it is not 94% diagnostic accuracy for aortic bioprosthetic obstruction. CT should complement echocardiography, and persistent clinical concern—particularly for infection—still needs evaluation.[3]
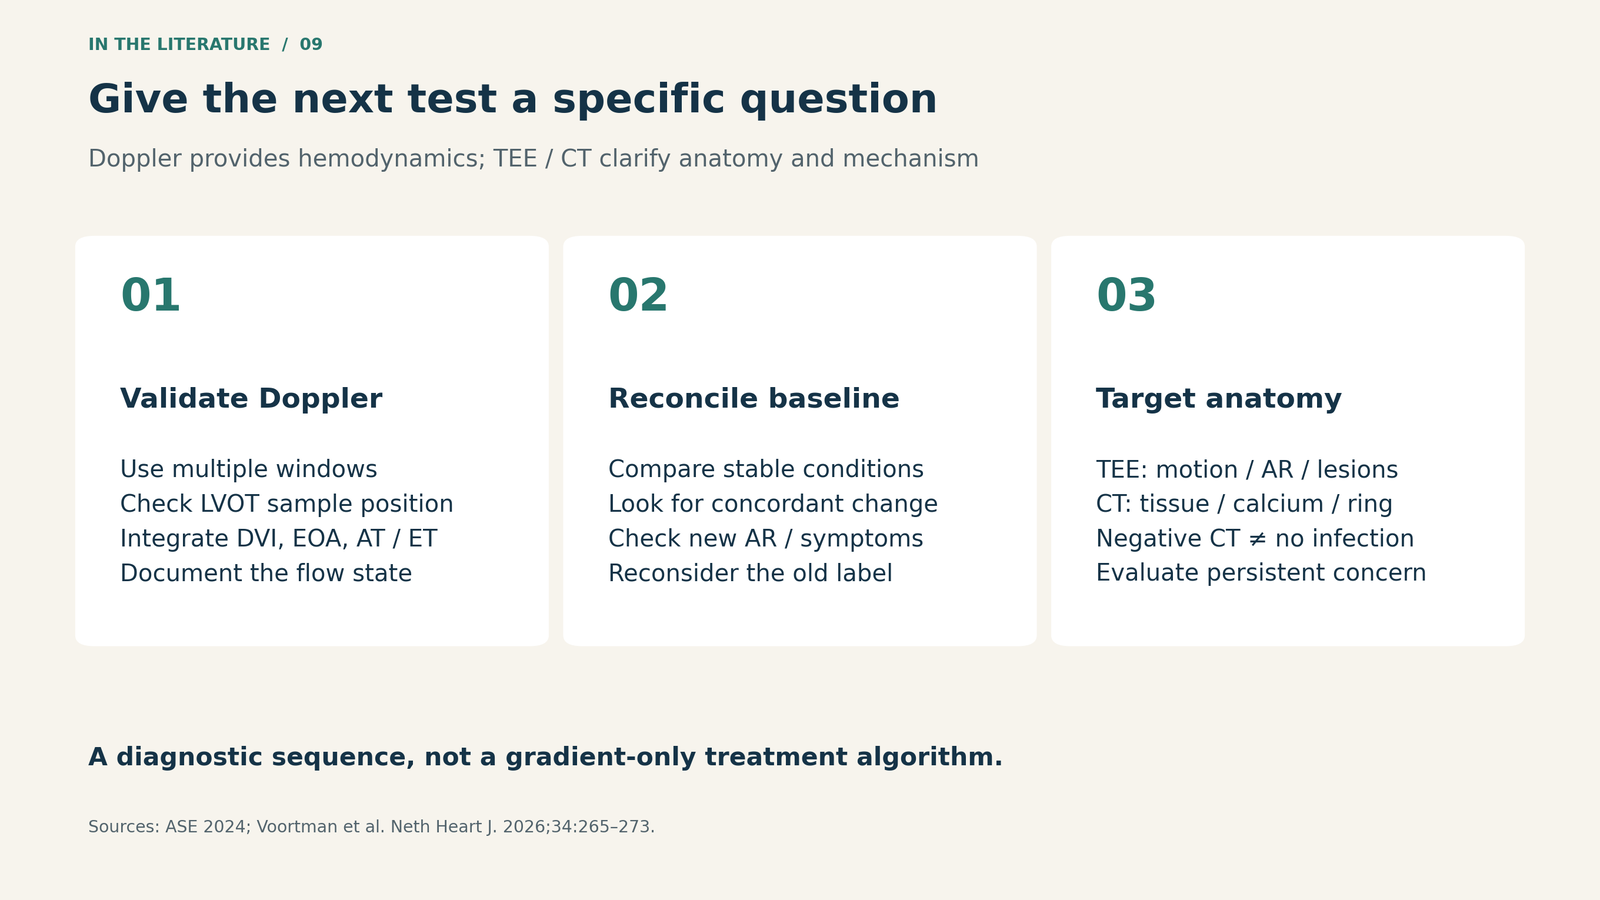
Figure 4. A practical sequence derived from the guideline and CT study. Resolve inconsistent measurements before assigning a mechanism or choosing treatment.[1, 3]

Three takeaways
- Treat a high gradient as a finding that needs an explanation. Pair it with DVI or EOA, timing, flow and leaflet morphology.
- Bring the baseline into the room. Persistent mismatch and newly acquired dysfunction are different patterns, and may coexist.
- Choose additional imaging for the unresolved question. Establish the mechanism before allowing the gradient alone to drive a treatment decision.
References
- Zoghbi WA, Jone PN, Chamsi-Pasha MA, et al. Guidelines for the evaluation of prosthetic valve function with cardiovascular imaging: a report from the American Society of Echocardiography developed in collaboration with the Society for Cardiovascular Magnetic Resonance and the Society of Cardiovascular Computed Tomography. J Am Soc Echocardiogr. 2024;37(1):2–63. doi:10.1016/j.echo.2023.10.004.
- Ben Zekry S, Saad RM, Özkan M, et al. Flow acceleration time and ratio of acceleration time to ejection time for prosthetic aortic valve function. JACC Cardiovasc Imaging. 2011;4(11):1161–1170. doi:10.1016/j.jcmg.2011.08.012.
- Voortman M, von Birgelen C, Ties D, et al. Clinical value of computed tomography in suspected prosthetic valve dysfunction. Neth Heart J. 2026;34:265–273. doi:10.1007/s12471-026-02052-8.