Pressure readings, dynamic changes and study conditions.
Reading Library · Anesthesia Epochs · 中文版
Watch the companion film
2000: Michard — Pulse Pressure Variation and Fluid Responsiveness · Watch on YouTube
Historical anchor: 2000. Date details and source qualifications are explained below.
Can a pressure reading tell us how the heart will respond to an increase in preload? In their 2000 review, Michard and Teboul used Frank–Starling curves to distinguish these questions. Similar preload levels could correspond to different stroke-volume responses.[1, pp.282–284] They focused on the cyclic changes produced by mechanical ventilation.
Michard and colleagues published their study of pulse-pressure variation and fluid responsiveness in July that year.[2] In their September review, the two authors described studying 40 patients with acute circulatory failure related to sepsis. The question concerned respiratory changes in pulse pressure and the change in cardiac index after volume expansion.[1, pp.286–288] This is an attributed contemporary account, not a fluid rule for every patient.
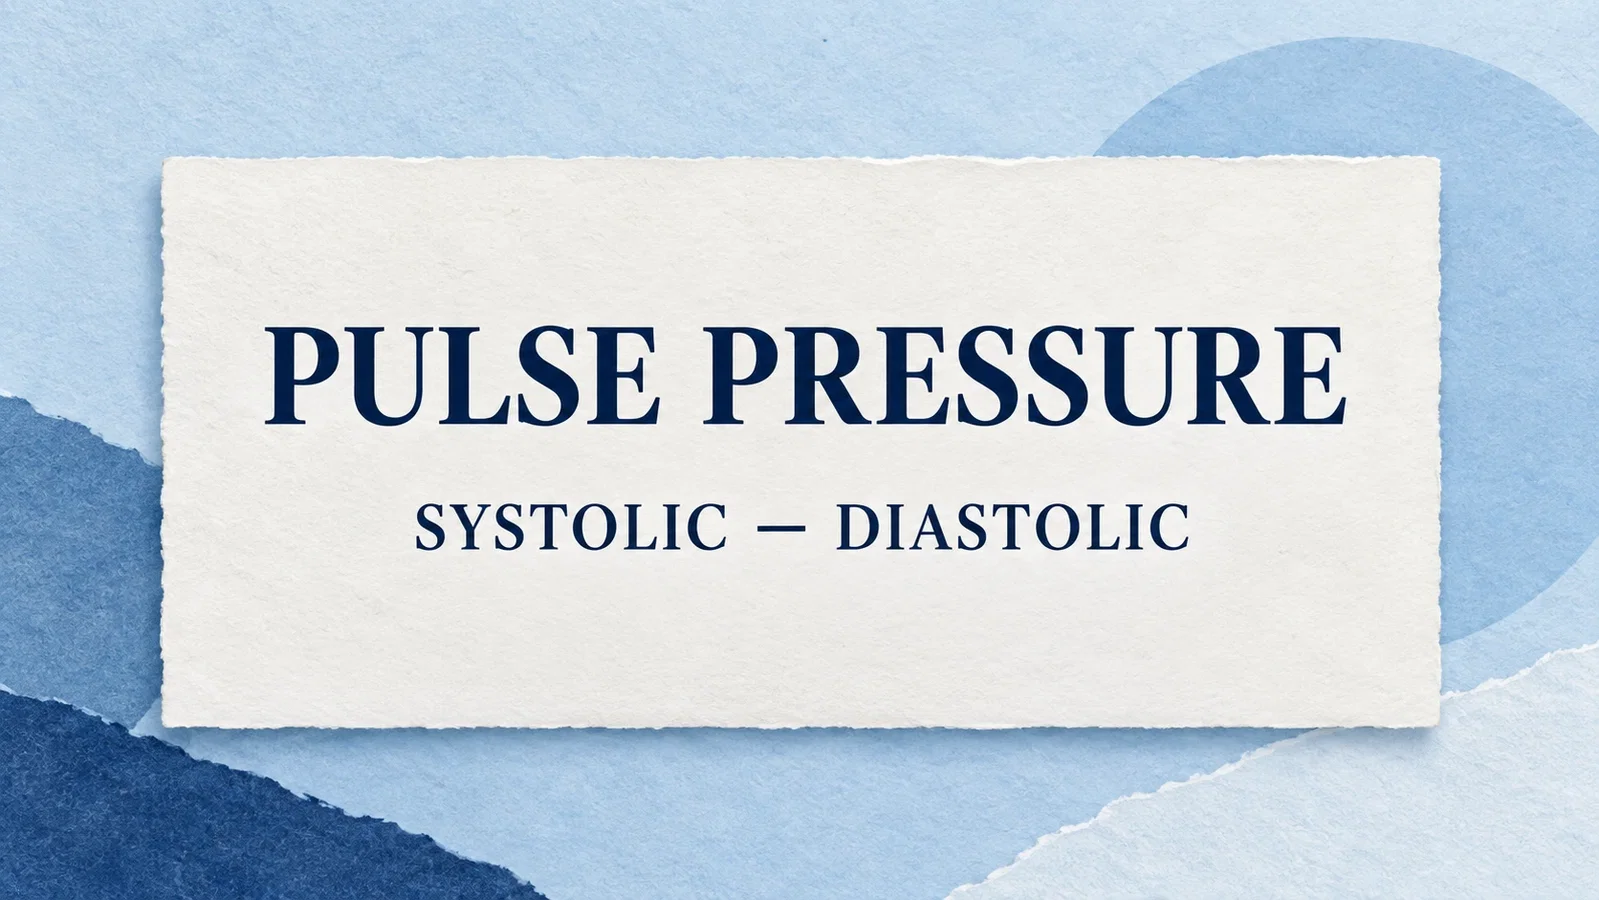
The review distinguished two quantities. Pulse pressure is systolic pressure minus diastolic pressure. Its respiratory variation compares the maximum and minimum pulse pressure within one breath, divides their difference by their mean and expresses the result as a percentage.[1, pp.286–287] Observation thus extended from a pressure level to its variation during breathing. The authors offered a physiological explanation without establishing which mechanism predominated in the study.[1, pp.284–285; 2, extracted text p.137]
This history can be read alongside the 1970: Swan and Ganz Bring Pulmonary Artery Pressure to the Bedside. Swan and colleagues described a balloon-tipped catheter for obtaining right-heart and pulmonary wedge pressures. The 2000 review examined the limits of such pressures in predicting a response and noted that radial or femoral arterial catheterization remained invasive.[3, pp.447–448; 1, pp.283,288] The connection concerns what can be measured and what the measurement can answer. It does not imply that one technology eliminated the other.

The review also stated its limits. The evaluated setting involved sedated, mechanically ventilated patients; use during spontaneous breathing still needed evaluation, and arrhythmias affected the analysis. Automatic calculation and display were proposed as future work.[1, pp.287–288] This article records a research question and its boundaries in 2000. It supplies no present-day thresholds, drug recommendations or fluid instructions.
The images are modern editorial concepts, not historical photographs, patient traces, clinical pathways or research data.
Sources and reading limits
- Michard F, Teboul JL. Using heart–lung interactions to assess fluid responsiveness during mechanical ventilation. Crit Care. 2000;4:282–289. PMID11094507. The complete eight-page publisher PDF, seven figures, two tables and 47 references were read; all eight page images were viewed. Published on 1 September 2000. The authors’ account of their own study is not independent replication.
- Michard F, et al. Relation between respiratory changes in arterial pulse pressure and fluid responsiveness in septic patients with acute circulatory failure. Am J Respir Crit Care Med. 2000;162:134–138. DOI10.1164/ajrccm.162.1.9903035. Indexed text from all five pages was previously read, with relevant passages reread for this article. The original PDF remains unavailable and no original page image has been viewed. NLM metadata verifies July, authorship and identity; damaged symbols and unviewed table values are not resolved from extracted text.
- Swan HJC, et al. Catheterization of the heart in man with use of a flow-directed balloon-tipped catheter. N Engl J Med. 1970;283:447–451. Original journal PDF archived from the USAN mirror. Only printed pages 447–448 and their images were reread for this article.
A response-threshold symbol differs between the review’s table and text. The original study’s MAP table still lacks visual verification. The affected numbers are excluded here. The original study, authors’ review and NLM record are interdependent, not three independent confirmations of every claim.
Sources and reading limits are stated above. Illustrations are labelled as original source images or AI-made. Historical accounts are educational; they are not current treatment instructions.
Continue exploring
Related reading
Related reading connects shared questions and contexts; it does not by itself establish historical influence.