In 1903 Willem Einthoven of Leiden described in Pflügers Archiv a string galvanometer that wrote the human electrocardiogram directly, recorded at 25 mm per second with 1 mm equal to 0.0001 volt and waves labelled P, Q, R, S and T.
Reading Library · Anesthesia Epochs · 中文版
Watch the education video (for clinicians)
1903: The String Galvanometer ECG — Willem Einthoven · Anesthesia Epochs Education Series
Every anaesthetic monitor shows an electrocardiogram, and every printed ECG runs at 25 mm per second on a grid of millimetre squares. Two anaesthesia timelines place the electrocardiogram in 1903, with Willem Einthoven of Leiden; the Australian Society of Anaesthetists speaks of the ECG being "introduced into clinical practice". The paper Einthoven published that year in Pflügers Archiv für die gesammte Physiologie, on the galvanometric recording of the human electrocardiogram, is a laboratory paper about an instrument. [1][2][3]
The problem with the capillary electrometer
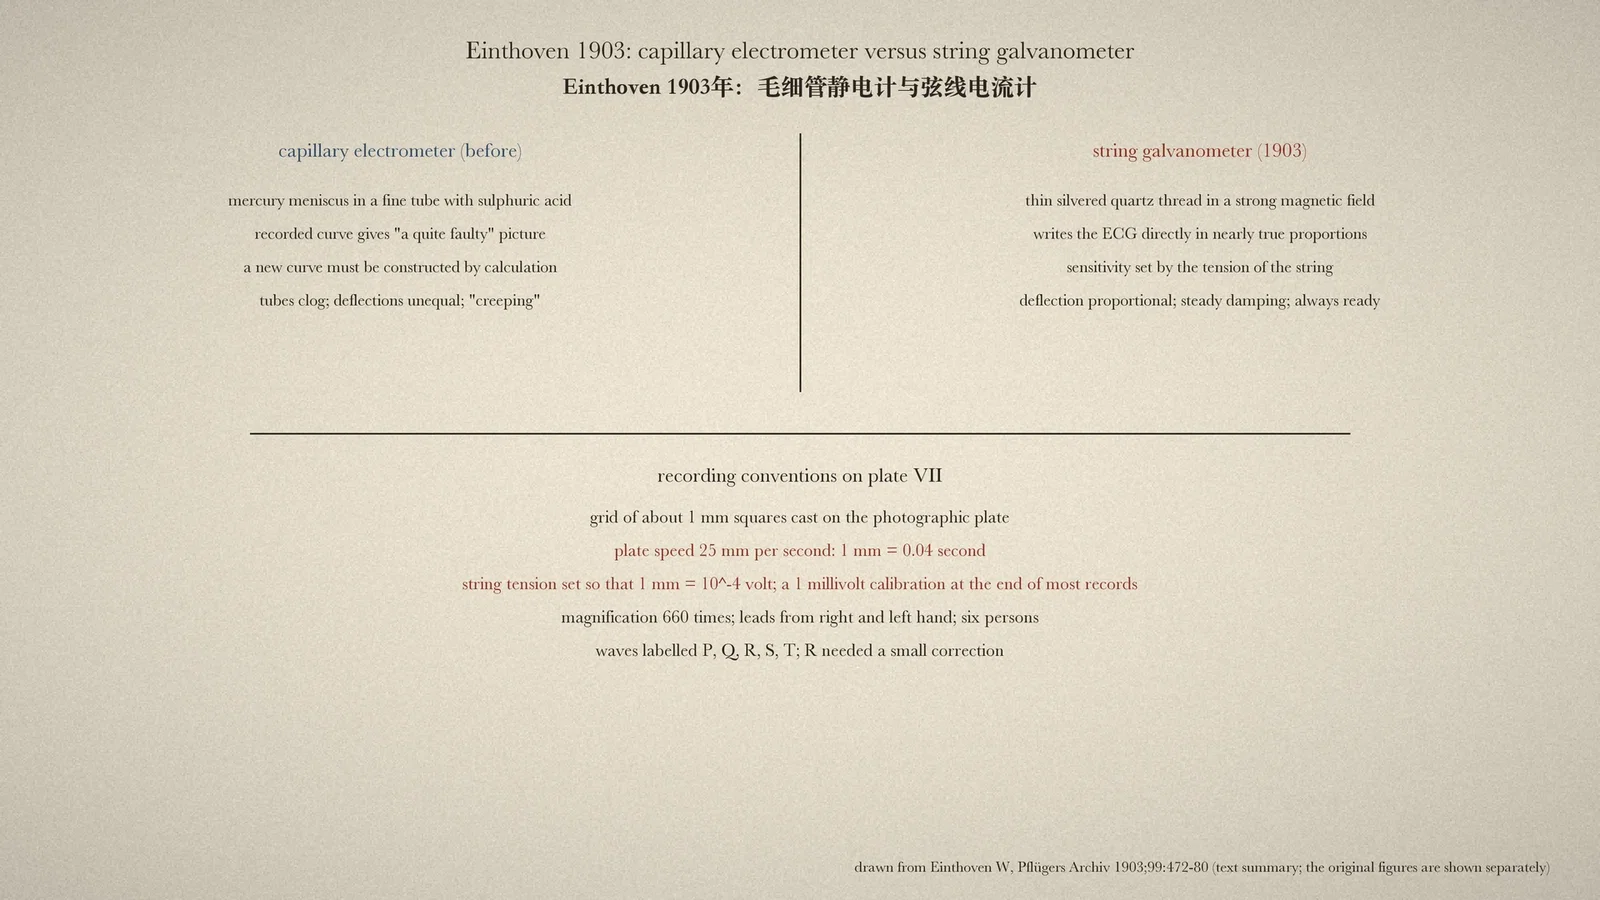
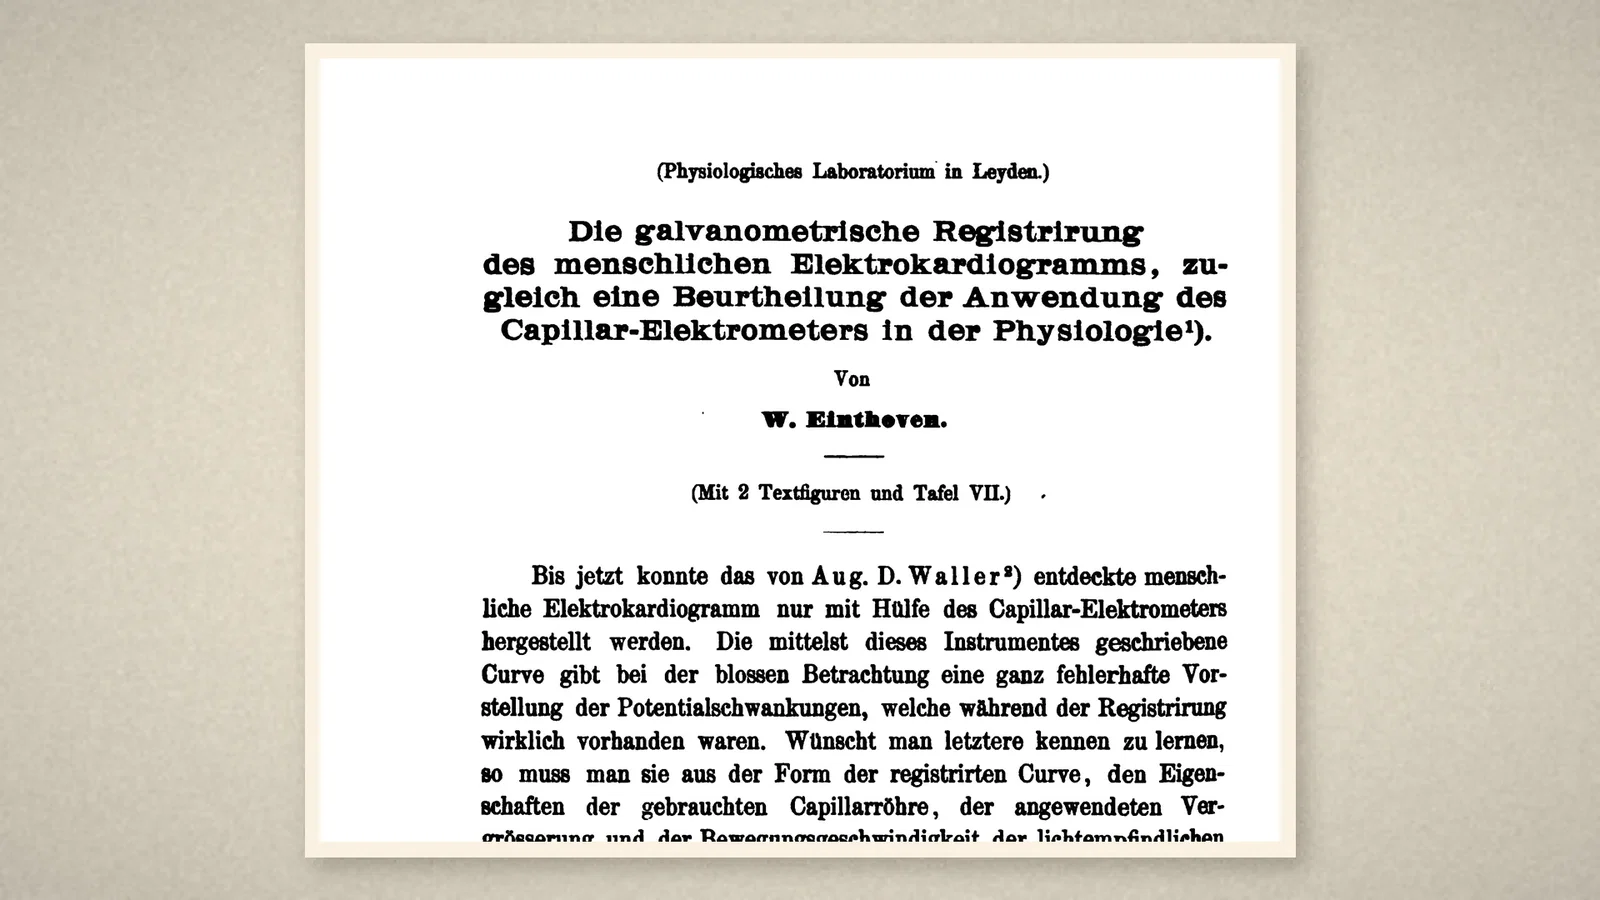
Einthoven did not claim to have discovered the electrocardiogram. The paper opens: "Until now the human electrocardiogram discovered by Aug. D. Waller could be produced only with the aid of the capillary electrometer." That instrument recorded the movement of a mercury meniscus in a fine tube against sulphuric acid, and "the curve written by means of this instrument gives, on simple inspection, a quite faulty idea of the potential variations" actually present. To know them, one had to calculate from the properties of the tube, the magnification and the speed of the plate, and construct a new curve. [1]
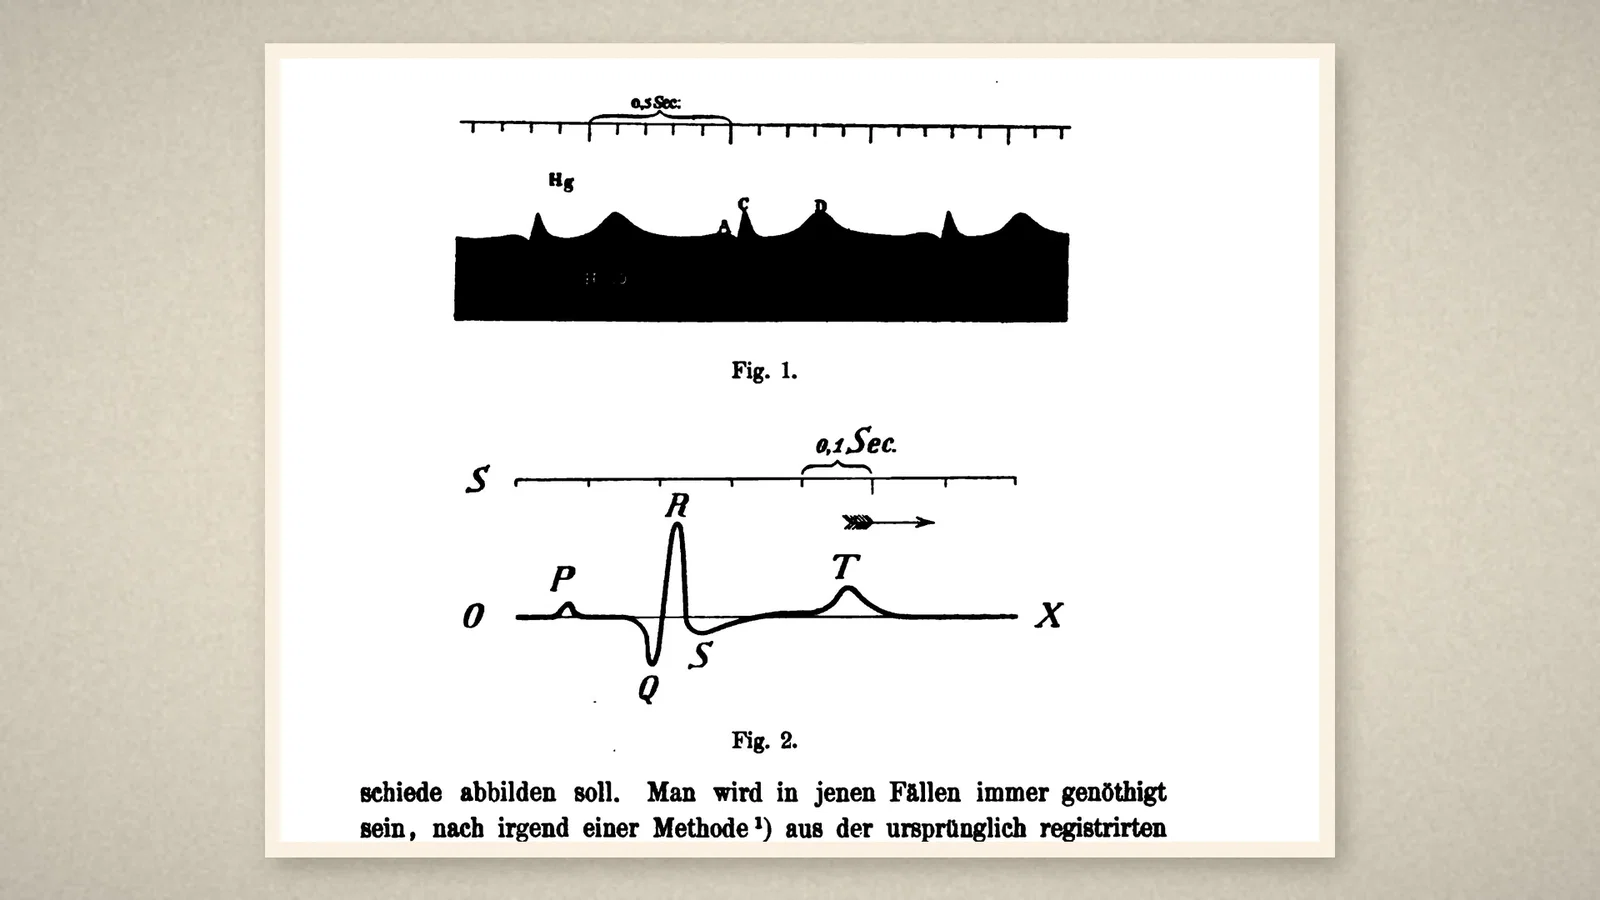
Einthoven illustrated the point with two text figures from the same man, recorded between right and left hand. Fig. 1 is the capillary-electrometer record, its peaks lettered with capitals such as C and D. Fig. 2 is the constructed curve, and here the letters are the ones every clinician knows: P, Q, R, S and T, on a baseline marked O to X, with a scale of 0.1 second. Only the constructed curve, Einthoven wrote, gave the true ratio of the peak heights. [1]
The string galvanometer
To avoid the construction, Einthoven had an instrument made that could "write the human electrocardiogram directly in nearly correct proportions". This instrument, "the string galvanometer, consists essentially of a thin silvered quartz thread, strung like a string in a strong magnetic field". A current through the thread moved it, and the movement, like that of the mercury meniscus, could be watched and photographed under strong magnification; by tightening or loosening the string, the sensitivity could be regulated precisely over a wide range. [1]
The paper lists the advantages over the capillary electrometer. The quartz thread, far lighter than a column of mercury, gave faster and larger deflections without overshoot; the deflection was exactly proportional to the current and equal in both directions; damping by air and by the magnetic field was regular, whereas capillary tubes could "stick" and had to be replaced; insulation was easier; the image of a straight string was sharper than that of a round meniscus; and the instrument was always ready for use. [1]
Plate VII and the conventions
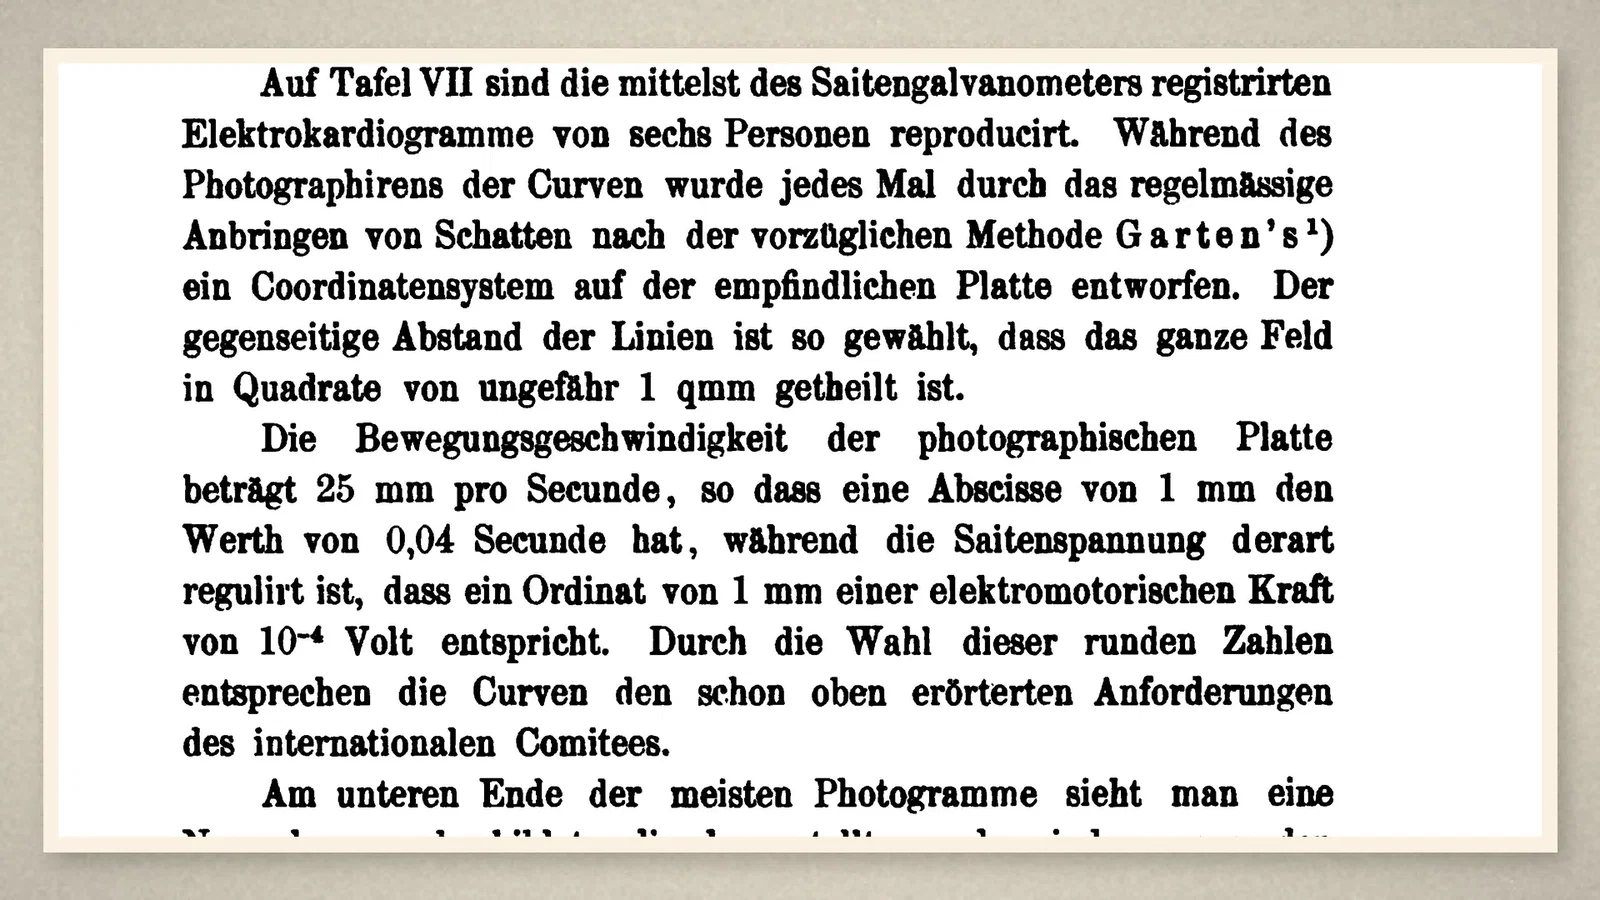
The paper was prompted by an international committee for the unification of methods in physiology, which wanted records in round, comparable units. Plate VII reproduced electrocardiograms of six persons recorded with the string galvanometer. While each curve was photographed, a grid of shadows was thrown onto the plate, dividing the field "into squares of about 1 sq mm". "The speed of movement of the photographic plate is 25 mm per second, so that an abscissa of 1 mm has the value of 0.04 second, while the tension of the string is regulated so that an ordinate of 1 mm corresponds to an electromotive force of 10^-4 volt." At the end of most records a standard deflection was written by switching 1 millivolt into the circuit, showing that the deflections were proportional. [1]
At a magnification of 660 times, the galvanometer record represented the potential differences between the hands "fairly exactly". The lower peaks P, Q, S and T needed no appreciable correction; only the tall, sharp R required a small one. Compared with the curve constructed earlier from the capillary electrometer, the new record showed the same peaks at the same relative heights, which Einthoven took as proof both of the old method and of the new instrument. One further observation stands out: the form of the curve was so constant for a given person that, with only a little practice, many individuals could be recognised from their electrocardiograms. [1]
What the record shows
Three things in these pages are on every ECG printed today: the letters P, Q, R, S, T; a recording speed of 25 mm per second on a millimetre grid; and a vertical scale tied to a calibration pulse of 1 millivolt (here 10 mm per millivolt). The paper contains no patient, no diagnosis and no anaesthetic; the step from the laboratory to the bedside and the operating room came later. The principle that a measuring instrument should write the true signal in standard units, with a calibration on the record, is the part that lasted.
Sources and reading limits
Read: Einthoven's paper in Pflügers Archiv vol. 99 (1903), pp. 472–480; the ASA and HAS timeline entries for 1903.
Not covered: plate VII itself, described here from the text; Einthoven's descriptions of the instrument in the Annalen der Physik and the Leiden Onderzoekingen; Waller's paper of 1889; any clinical or anaesthetic use of the ECG. The exact issue date within 1903 is not given in the pages read. The paper credits Waller with the human electrocardiogram. Quotations from the German are translated.
- Einthoven W. Die galvanometrische Registrirung des menschlichen Elektrokardiogramms, zugleich eine Beurtheilung der Anwendung des Capillar-Elektrometers in der Physiologie. Pflugers Arch. 1903;99:472-80. Internet Archive
- Australian Society of Anaesthetists. Anaesthesia history timeline. 2024. ASA
- History of Anaesthesia Society. Timeline. HAS
Continue exploring
Related reading connects shared questions and contexts; it does not by itself establish historical influence.
Anesthesia Epochs · The Source Room · About & Editorial Method
Published November 2, 2026. Sources and reading limits are stated above. Illustrations are labelled as original source images or AI-made. Historical accounts are educational; they are not current treatment instructions.