
A psychologist's paper on rating people's traits set out the method later borrowed for pain: a check mark anywhere along an unbroken straight line between two described extremes.
Reading Library · Anesthesia Epochs · 中文版
Watch the education video (for clinicians)
1923: Freyd's Graphic Rating Scale — The Line Before the Pain Scale · Anesthesia Epochs Education Series
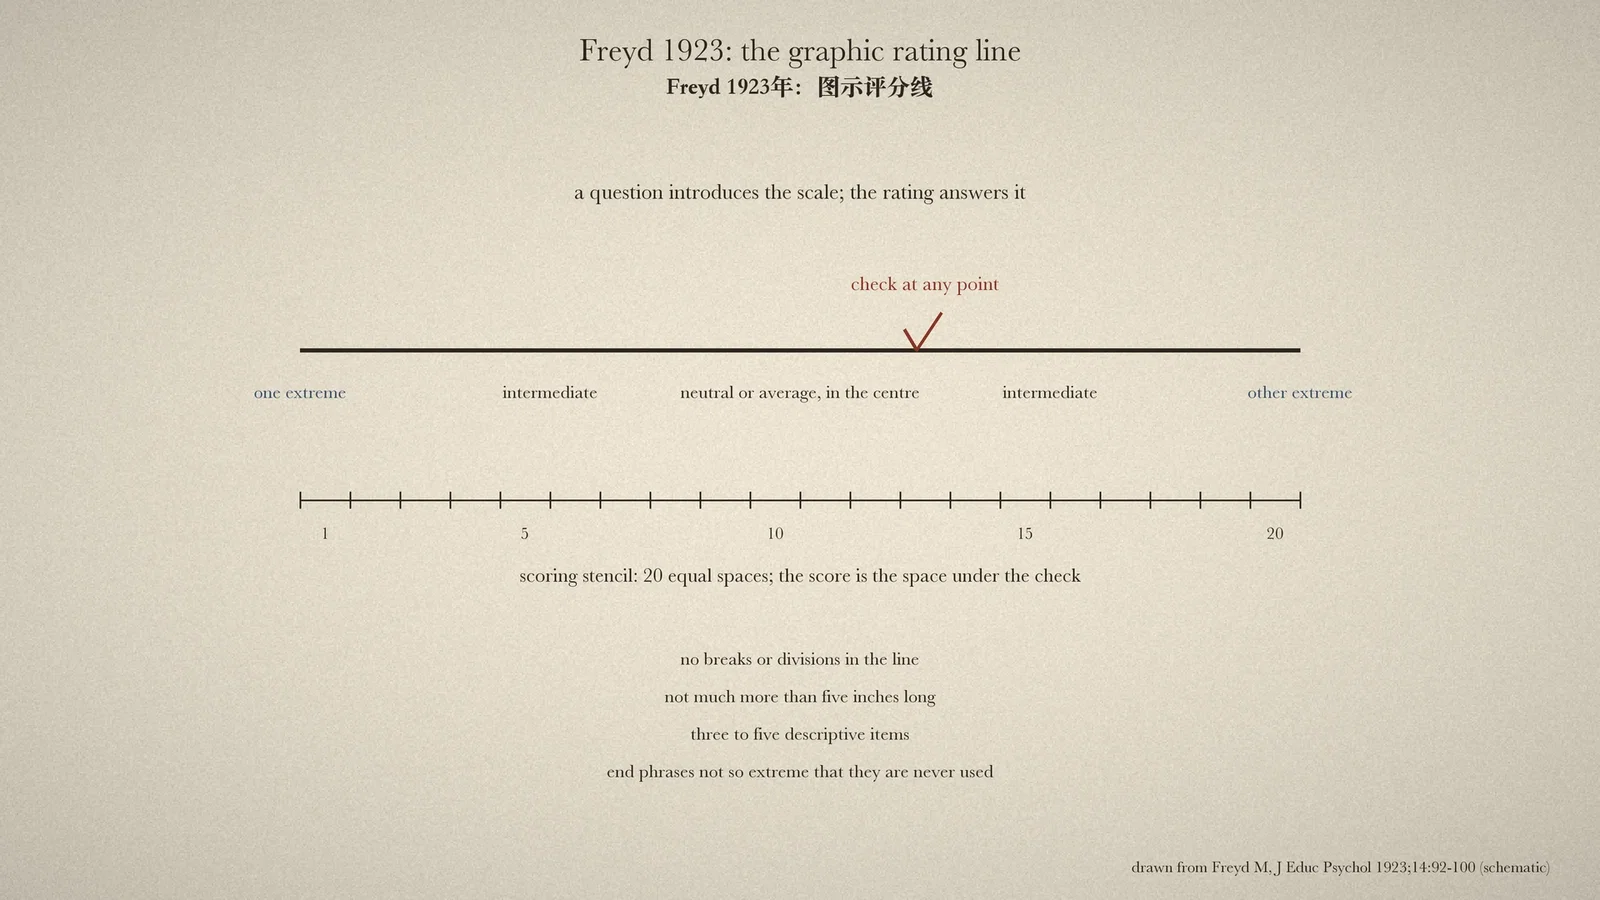
Asking a patient to mark pain on a plain line, "no pain" at one end and "worst pain imaginable" at the other, is so familiar that its origin is rarely asked about. The line did not begin in medicine. It was worked out by applied psychologists rating workers and students, and one of the fullest early descriptions is "The graphic rating scale" by Max Freyd of the University of Pennsylvania, in the Journal of Educational Psychology of February 1923. This article reads Freyd's paper and two recent open-access articles that trace the visual analogue scale back to it. [1] [2] [3]
Why rate at all
Freyd began from a problem of psychological measurement. "For many types of psychological phenomena ratings are the only practical equivalents of objective measurements", especially for introspective or verbal reports. An effective rating scale might fall short of objectivity, but "in skilled hands" could equal slipshod objective measurement, and its construction demanded "the same skill and care as the laboratory set-up". Freyd's first example was Galton's scale of the vividness of mental imagery, built from descriptive phrases that a subject could choose instead of describing the experience freely. [1]
The method
After surveying earlier ways of rating, Freyd described the newest: "the graphic rating method is a combination of the two preceding methods", rating on a line and checking descriptive phrases. "In this case the rating is indicated by a check along a straight line, under which are printed descriptive phrases indicative of varying degrees of the trait, from one extreme to the other." The method, Freyd wrote, "was originated in the Scott Co. Laboratory in 1920", was being used by the Scott Company and the Bureau of Personnel Research at the Carnegie Institute of Technology, and its "only original feature" was that combination of two methods already in existence. [1]
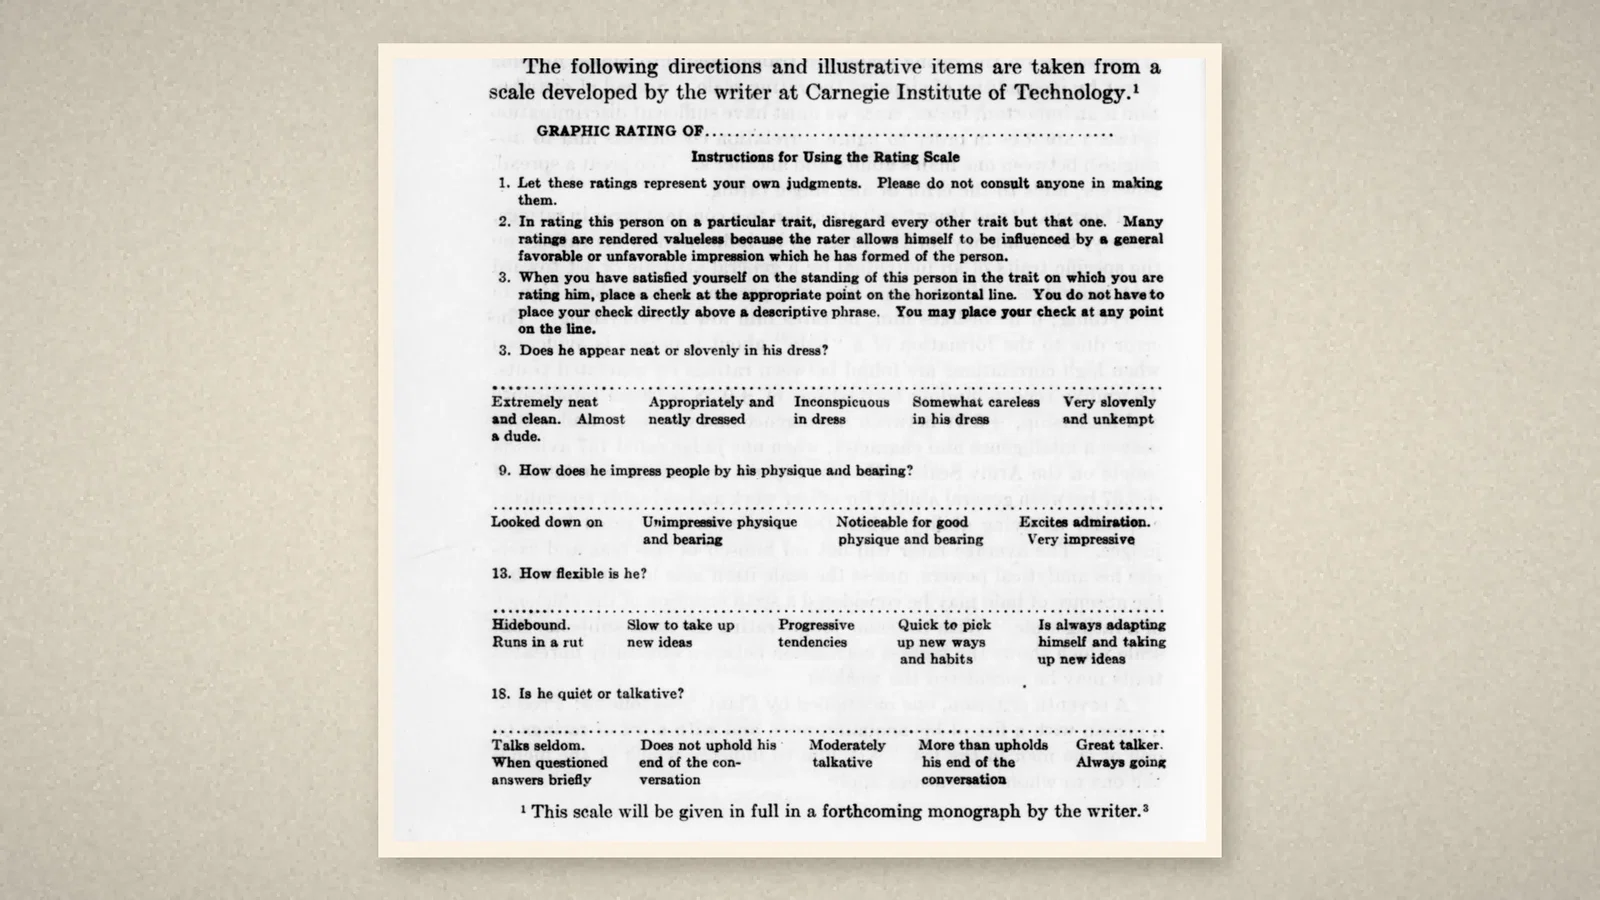
Freyd's own sample scale, developed at the Carnegie Institute of Technology, told raters to "place a check at the appropriate point on the horizontal line. You do not have to place your check directly above a descriptive phrase. You may place your check at any point on the line." Twenty traits could be rated in about ten minutes. To score them, a stencil as long as the line was divided into 20 numbered spaces of equal length and laid beneath it; the score was the space under the check. [1]
What the line gives the rater
Quoting Hayes and Paterson, Freyd named the method's two basic features: the rater "is freed from direct quantitative terms in judging men", and can discriminate as finely as the rater chooses. Freyd added that it was simple, interesting, quick to fill in and easy to score, and that "the fineness of the scoring method may be altered at will", from 1 to 5 or from 1 to 100. Freyd's own data suggested that the graphic scale "tends to eliminate halo", the habit of rating every trait by one general impression. [1]
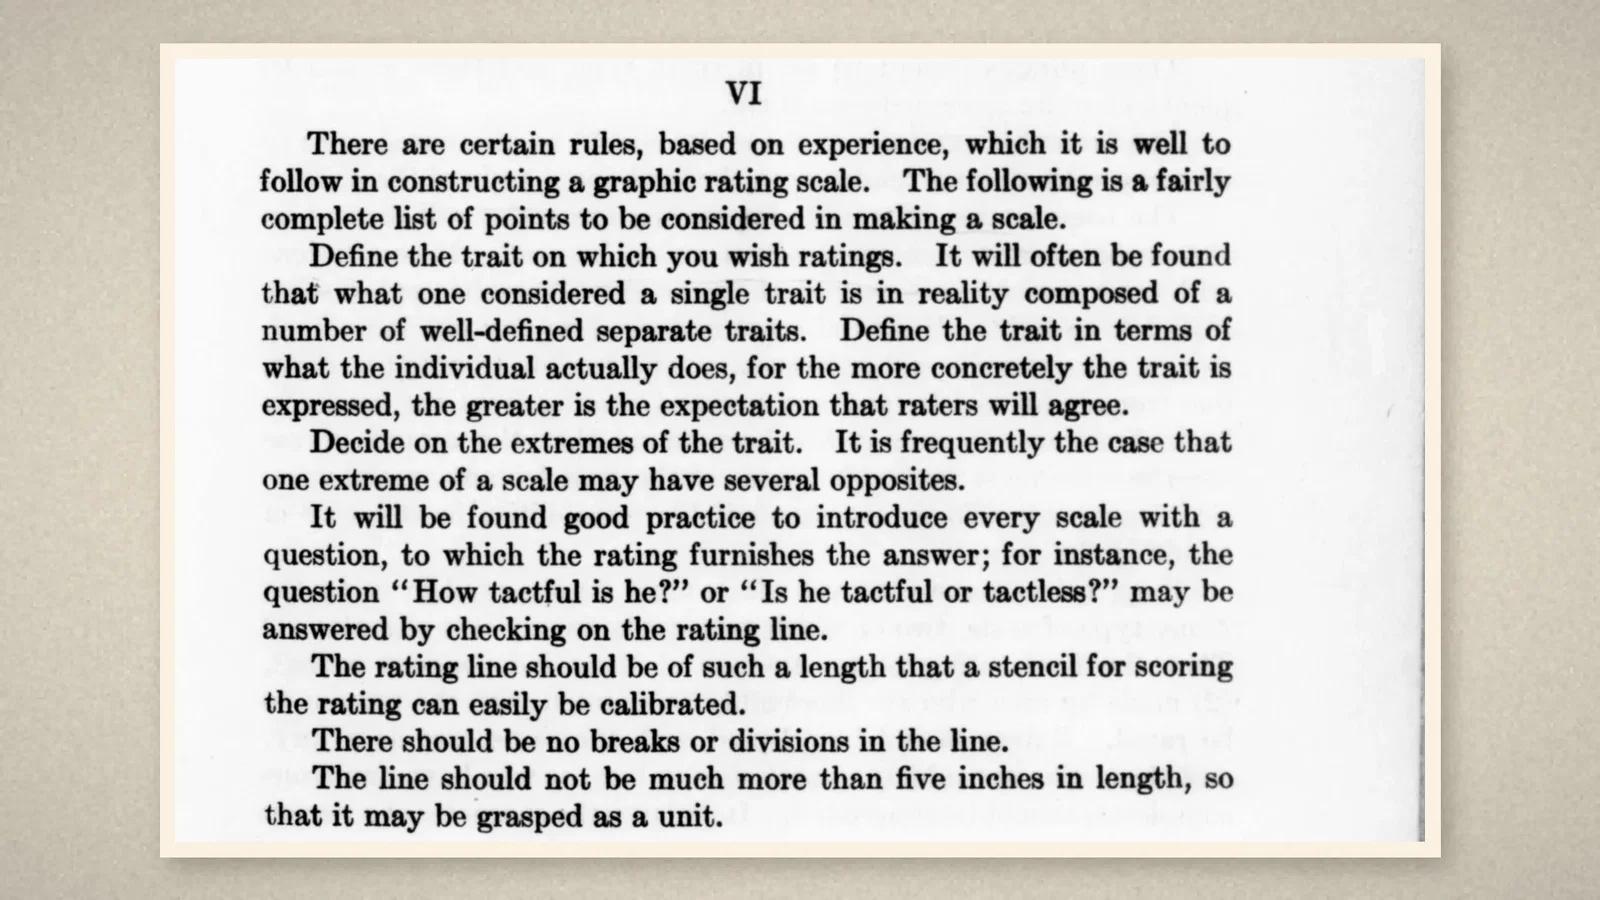
The paper closes with rules that read like advice for any modern scale. Define the trait concretely; decide on its extremes; introduce each scale with a question that the rating answers. "There should be no breaks or divisions in the line." It "should not be much more than five inches in length, so that it may be grasped as a unit." Use three to five descriptive items, put the neutral one in the centre, and do not word the end phrases so extremely that nobody ever uses them. [1]
From people to pain
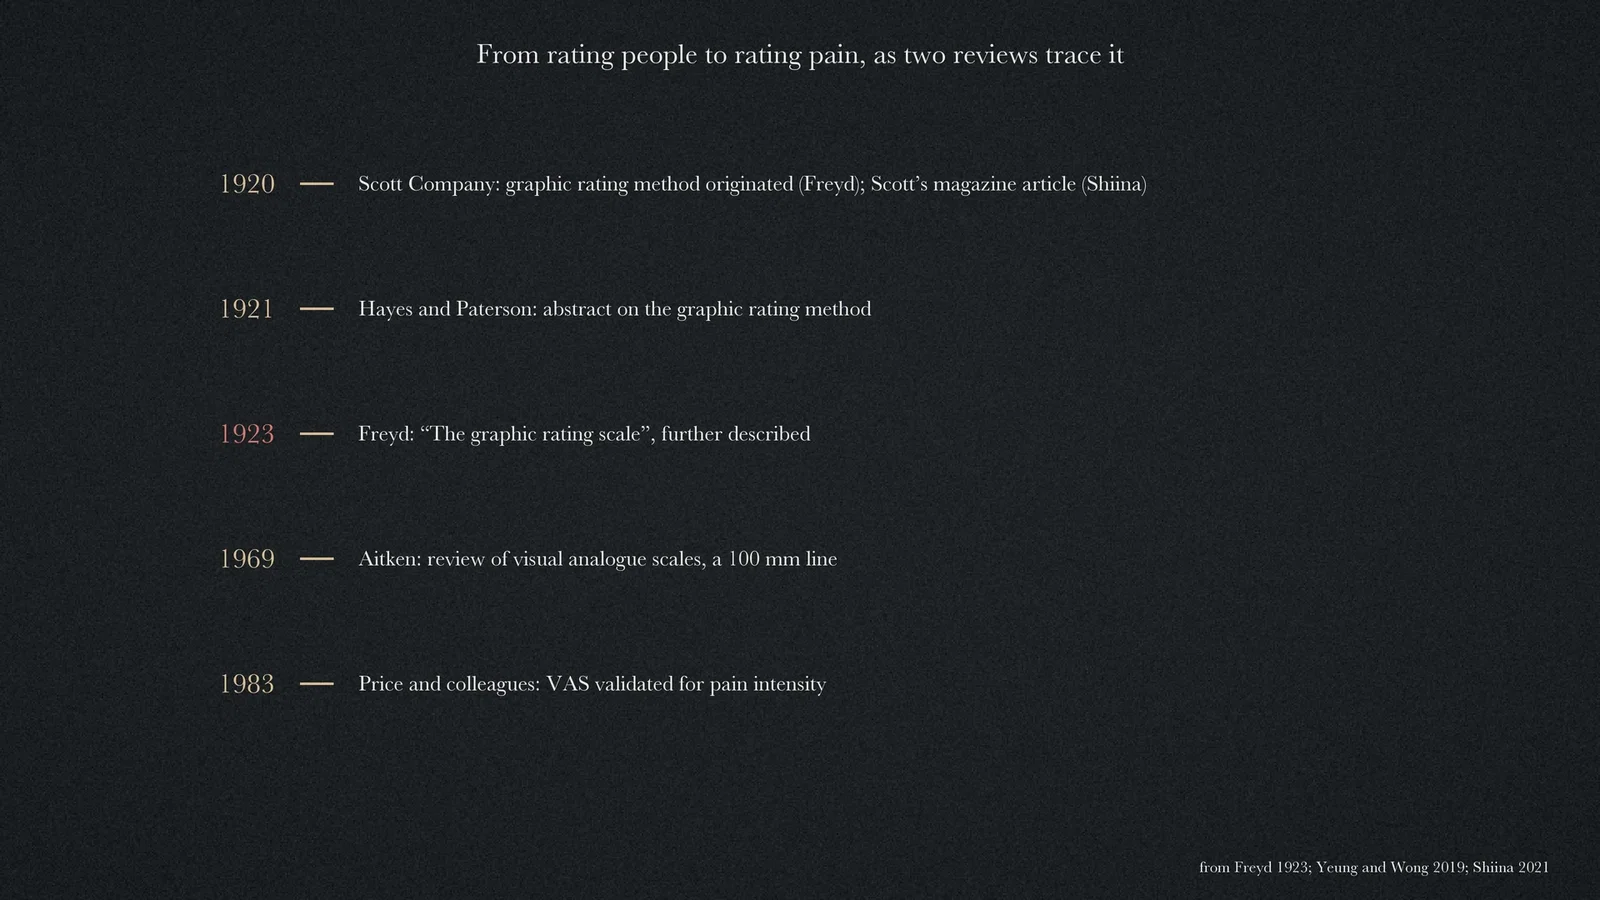
Freyd's subject was people, not pain, and the paper never mentions pain. The connection is made by later scholarship. In 2019 A. W. K. Yeung and N. S. M. Wong analysed more than 32,000 references cited by 958 psychology articles on the visual analogue scale and identified Hayes and Patterson's 1921 abstract on the graphic rating method as the origin of the scale, with Freyd's 1923 paper as a further description. Their table places Aitken's 1969 review, which advocated a 100 mm line, and Price and colleagues' 1983 validation of the scale "for measuring pain intensity" further along the same line of citation. [2]
A 2021 commentary by K. Shiina adds a caution. Hayes and Patterson's 1921 item was a short conference abstract, and the graphic rating scale was introduced "gradually": W. D. Scott described it in a commercial magazine in November 1920, and it was "a joint achievement of Scott Co.", not one person's invention. [3] That matches Freyd's own account of where the method came from.
What the record shows
The pain line inherited its main features from a tool for rating workers: an unbroken line that frees the rater from numbers, descriptive anchors at the ends, a mark placed anywhere, and a score read off afterwards. Freyd's 1923 paper is the most complete early statement of those features, by its author's own account a description of a Scott Company method rather than an invention.
Sources and reading limits
Read: Freyd's 1923 article in full; the open-access full texts of Yeung and Wong (2019) and Shiina (2021).
Not covered: Hayes and Paterson's 1921 abstract, Scott's 1920 article and the Scott Company bulletins, known here only through Freyd and the two reviews; Aitken 1969 and Price et al. 1983, known only from Yeung and Wong's table; early pain-scale papers. The second author of the 1921 abstract is spelled "Paterson" by Freyd and "Patterson" by Yeung and Wong. Quotations keep the authors' wording.
Two illustrations are page crops from Freyd's article; two are drawn from the sources.
- Freyd M. The graphic rating scale. J Educ Psychol. 1923;14(2):83-102. Internet Archive
- Yeung AWK, Wong NSM. The historical roots of visual analog scale in psychology as revealed by reference publication year spectroscopy. Front Hum Neurosci. 2019;13:86. DOI
- Shiina K. Commentary: The historical roots of visual analog scale in psychology as revealed by reference publication year spectroscopy. Front Hum Neurosci. 2021;15:711691. DOI
Continue exploring
Related reading connects shared questions and contexts; it does not by itself establish historical influence.
Anesthesia Epochs · The Source Room · About & Editorial Method
Published November 2, 2026. Sources and reading limits are stated above. Illustrations are labelled as original source images or AI-made. Historical accounts are educational; they are not current treatment instructions.