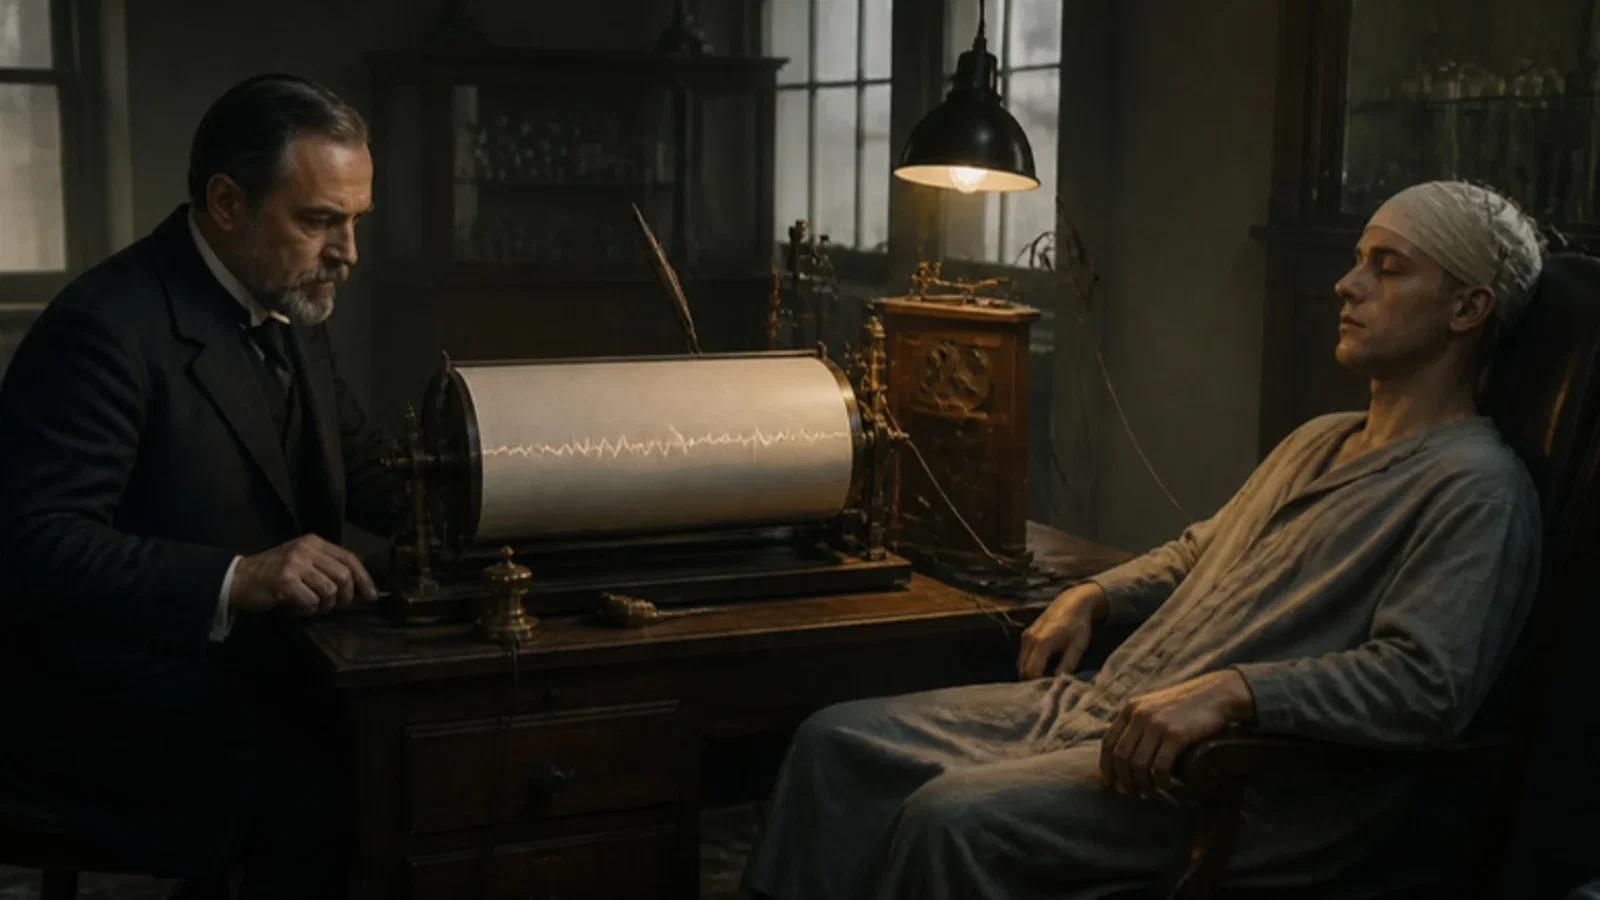
In Hans Berger's own 1935 account, the first recording came in Jena in 1924, with needle electrodes on the dura of a young man with a decompressive trepanation; Berger waited until 1929 to publish and name the 'electroencephalogram of man', with alpha waves of 8 to 11 per second up to 0.2 millivolt that vanished in chloroform narcosis and returned step by step on waking.
Reading Library · Anesthesia Epochs · 中文版
Watch the education video (for clinicians)
1924: Berger's Electroencephalogram — Jena · Anesthesia Epochs Education Series
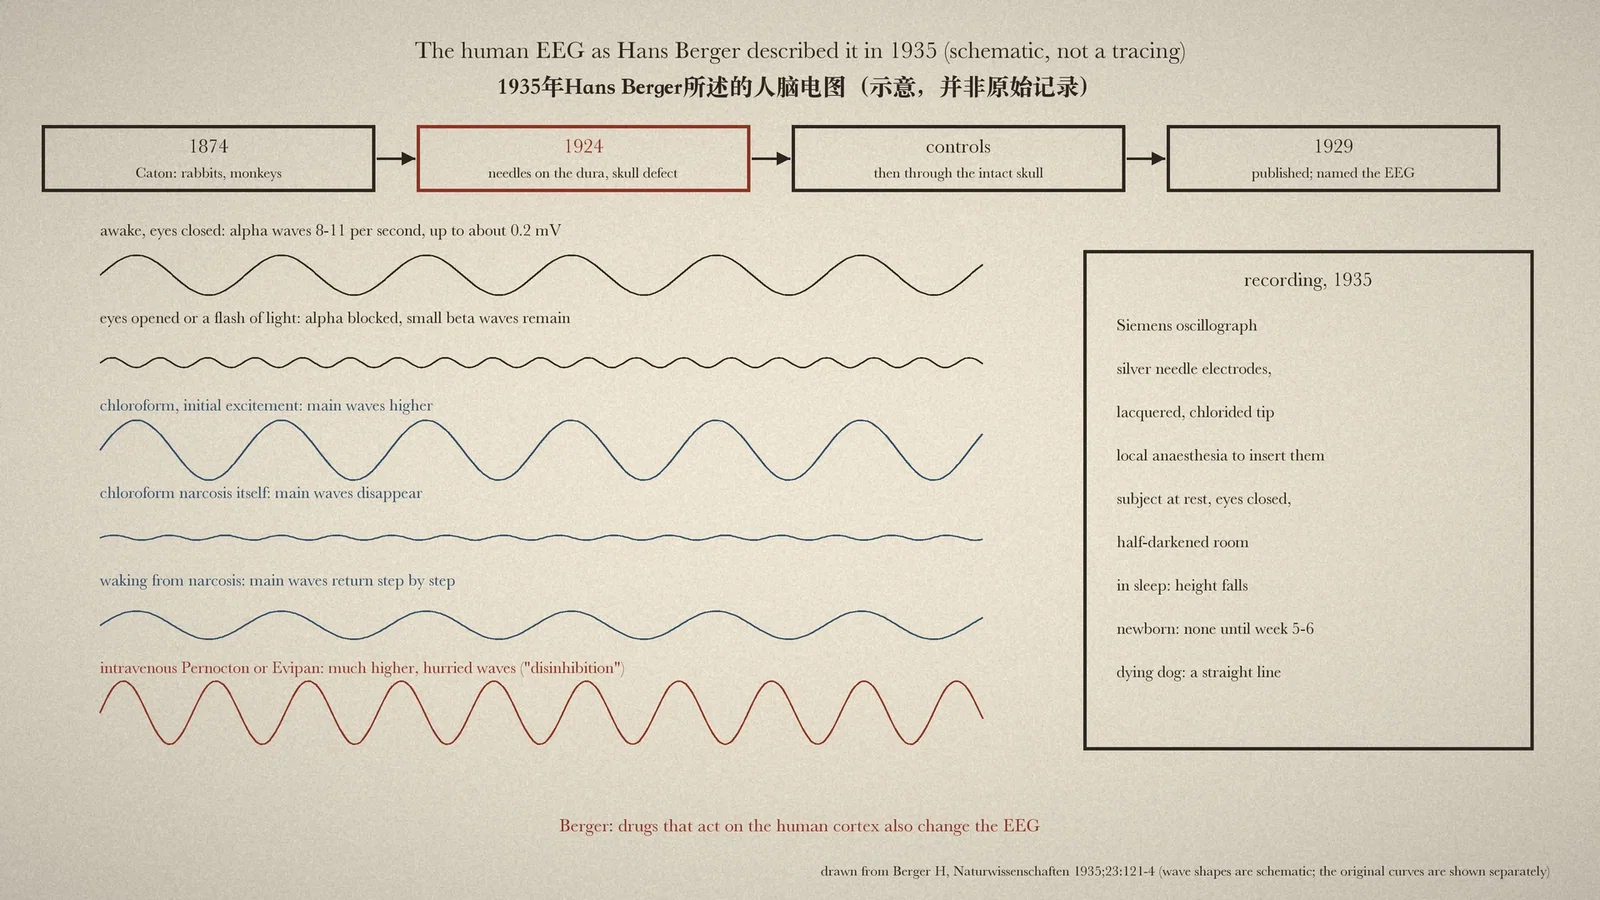
Processed EEG monitors that estimate the depth of anaesthesia depend on a simple observation: the electrical rhythm of the cortex changes as anaesthetic drugs take hold. The Australian Society of Anaesthetists (ASA) timeline records for 1924 "Electroencephalogram developed (details not published until 1929)" by Hans Berger, psychiatrist at Jena University. Berger's 1929 paper was not available for this article. Instead it reads Berger's own summary of the discovery, written for Die Naturwissenschaften in February 1935, which tells the story of 1924 in Berger's words and describes what chloroform and other narcotics did to the curve. [1][2][3]
1924 and five years of doubt
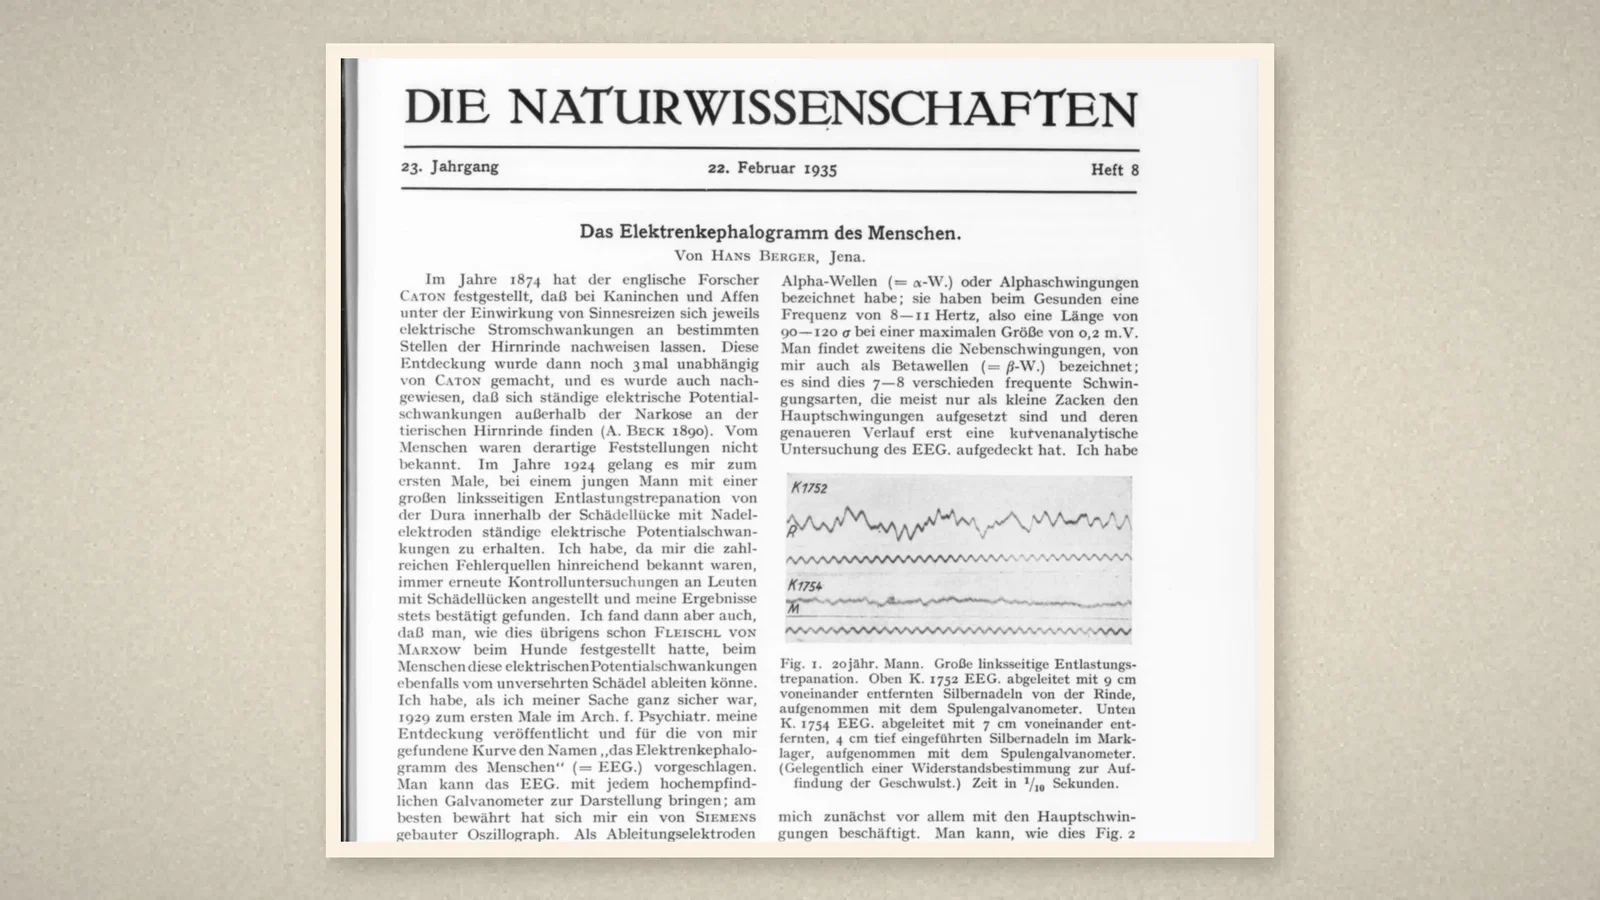
Berger began with the animal work. In 1874 the English investigator Caton had found electrical changes in the cortex of rabbits and monkeys when the senses were stimulated; the finding was made three more times independently, and Beck showed in 1890 that continuous potential fluctuations could be recorded from the animal cortex outside narcosis. "Nothing of the kind was known in man. In the year 1924 I succeeded for the first time", in a young man with a large left-sided decompressive trepanation, in obtaining continuous electrical potential fluctuations from the dura within the skull defect, using needle electrodes. [1]
Berger knew the "numerous sources of error", and kept repeating control studies in people with skull defects, always confirming the result. Then came the observation that the same fluctuations could be recorded through the intact skull. "When I was quite sure of my case" Berger published, for the first time in 1929 in the Archiv für Psychiatrie, and proposed for the curve the name "the electroencephalogram of man". [1]
How it was recorded
Any highly sensitive galvanometer would show the EEG, but a Siemens oscillograph had served best. Berger used needle electrodes of pure silver, lacquered to within a millimetre of the tip, with a freshly chlorided point, introduced to the dura through a bone defect or under the periosteum of the intact skull; this was "not possible without local anaesthesia". The potentials arose in the cortex itself: where a tumour had destroyed the cortex between the electrodes, the EEG was absent. [1]
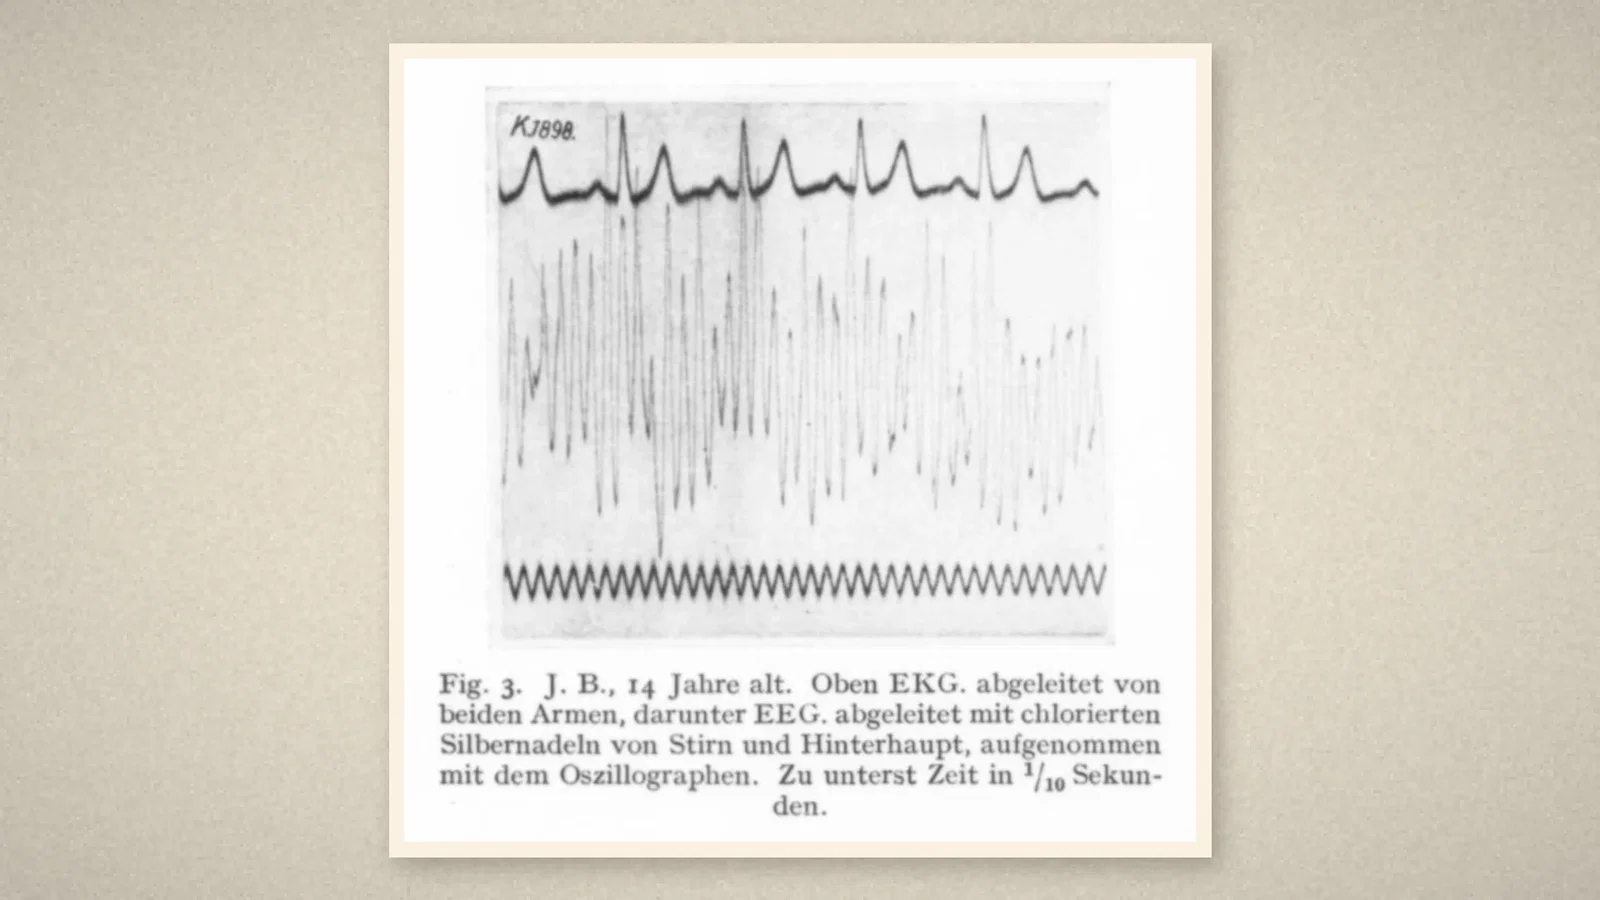
The main oscillations, which Berger called alpha waves, ran in health at 8 to 11 per second, 90 to 120 thousandths of a second long, at most about 0.2 millivolt. Smaller beta waves rode on them. The best records came with the subject lying at complete physical and mental rest, eyes closed, in a half-darkened room. In sleep the EEG remained but fell considerably in height. A flash of light, or simply opening the eyes, abolished the alpha waves after 0.2 to 0.3 seconds, and pain could make a recording impossible. Berger's Fig. 3 shows the curve from the forehead and occiput of a 14-year-old, recorded with the oscillograph under an ECG. [1]
Drugs and narcosis
"Drugs that, as experience shows, influence the activity of the human cerebral cortex also act on the course of the EEG." Cocaine given subcutaneously increased the height of the main waves without changing their length. Scopolamine-morphine, at full effect, made them disappear. "In chloroform narcosis there is, if a state of excitement appears at its beginning, an increase in height, but in the narcosis itself a disappearance of the main waves of the EEG." They returned "step by step" as the patient gradually woke. Other narcotics given intravenously, such as Pernocton or Evipan, produced quite different changes: a considerable increase in height and a hurried course, which Berger read as disinhibition of the cortex, the same picture seen in coal-gas poisoning, oxygen lack and a major epileptic fit. In a dying dog the main waves grew flatter and slower until the galvanometer drew a straight line. [1]
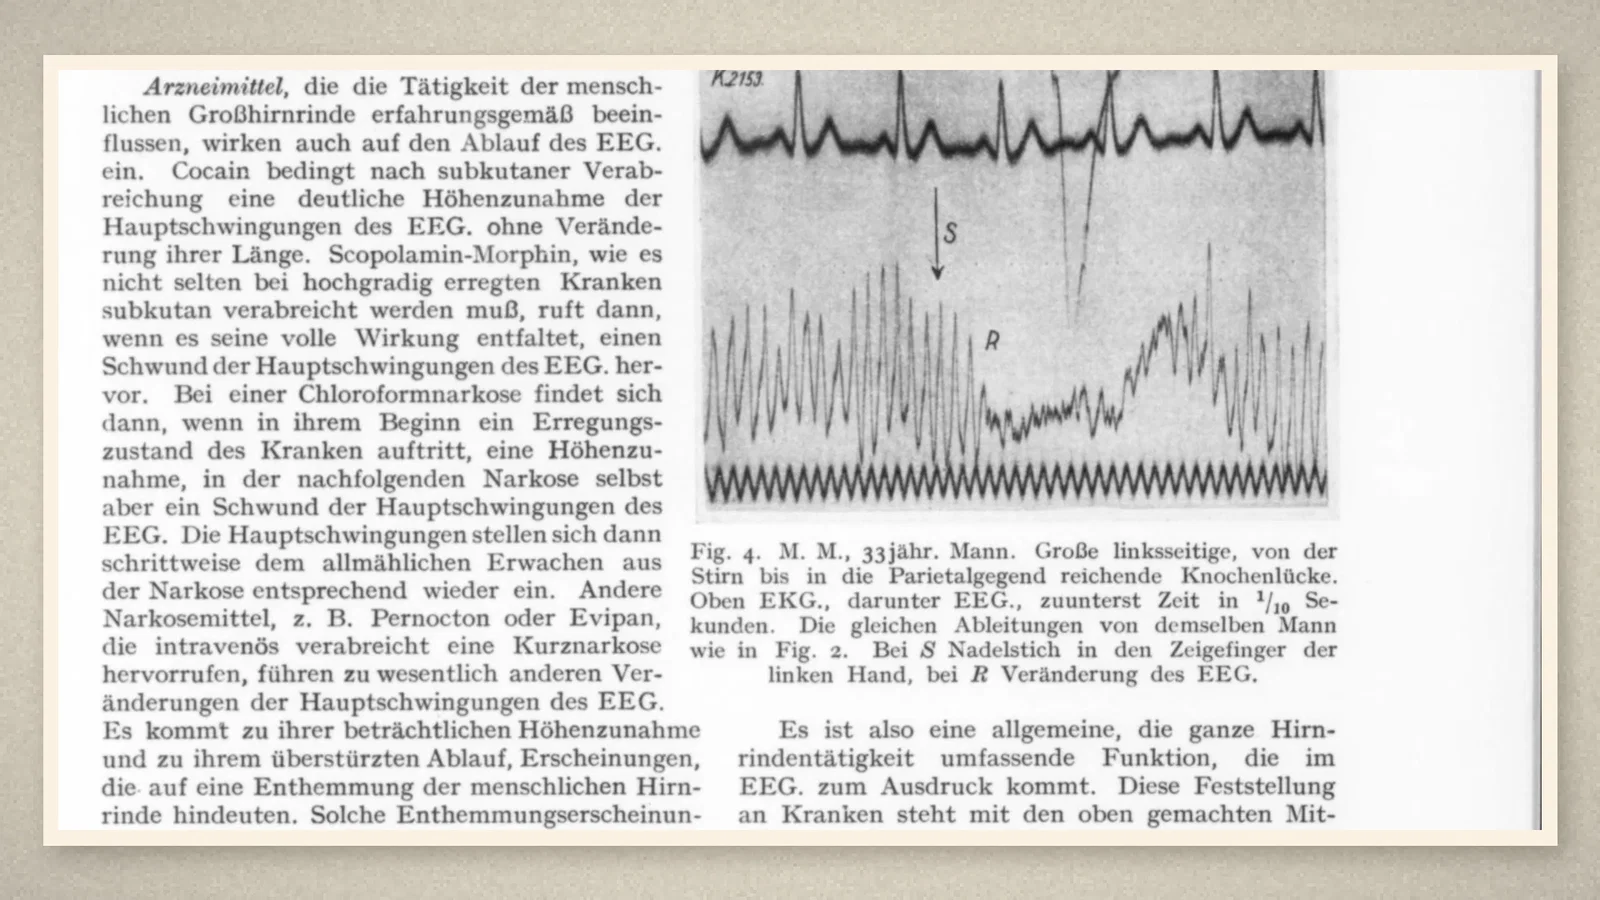
By 1937, in a second article in the same journal, Berger could say the curve had been recorded in several hundred people, always with the characteristic form, "exactly as holds for the electrocardiogram", and compared the task of interpreting its waves with Einthoven's interpretation of the ECG. [2]
What the record shows
Berger's few sentences on chloroform already contain the pattern that anaesthetic EEG monitoring would later exploit: a change in the curve with induction, loss of the dominant rhythm in established narcosis, and its staged return on emergence, with different drug classes leaving different signatures. The care Berger took over artefact, control recordings and five years of delay before publication is also part of the lesson.
Sources and reading limits
Read: Berger H, Die Naturwissenschaften 1935;23:121-4, in full, including Figs. 1-4; Berger H, Die Naturwissenschaften 1937;25:193-6; the ASA timeline entry for 1924.
Not covered: Berger's 1929 paper in the Archiv für Psychiatrie und Nervenkrankheiten (87:527) and the rest of that series; Berger's 1924 records; later work on the EEG as a monitor of anaesthesia. The 1924 recording is therefore given in Berger's retrospective account of 1935, not from a contemporary document. The drug observations are brief and without numbers, and are reported as Berger's. Patients appear in the source only by initials and age. Berger credits earlier animal work to Caton and Beck. German quotations are translated for this article.
Three illustrations are crops of the 1935 article, including its original curves; one is drawn from the text and shows stylised, not traced, waves.
- Berger H. Das Elektrenkephalogramm des Menschen. Naturwissenschaften. 1935;23:121-4. Internet Archive
- Berger H. Das Elektrenkephalogramm des Menschen und seine Deutung. Naturwissenschaften. 1937;25:193-6. Internet Archive
- Australian Society of Anaesthetists. Anaesthesia history timeline. 2024. ASA
Continue exploring
Related reading connects shared questions and contexts; it does not by itself establish historical influence.
Anesthesia Epochs · The Source Room · About & Editorial Method
Published November 2, 2026. Sources and reading limits are stated above. Illustrations are labelled as original source images or AI-made. Historical accounts are educational; they are not current treatment instructions.