A 676-patient single-centre study placed 89% sensitivity beside 39% positive predictive value without proving an effect on mortality.
Reading Library · Anesthesia Epochs · 中文版
Watch the companion film
2012: Singh — Validating the MEOWS Chart · Watch on YouTube
Historical anchor: 2012. Date details and source qualifications are explained below.
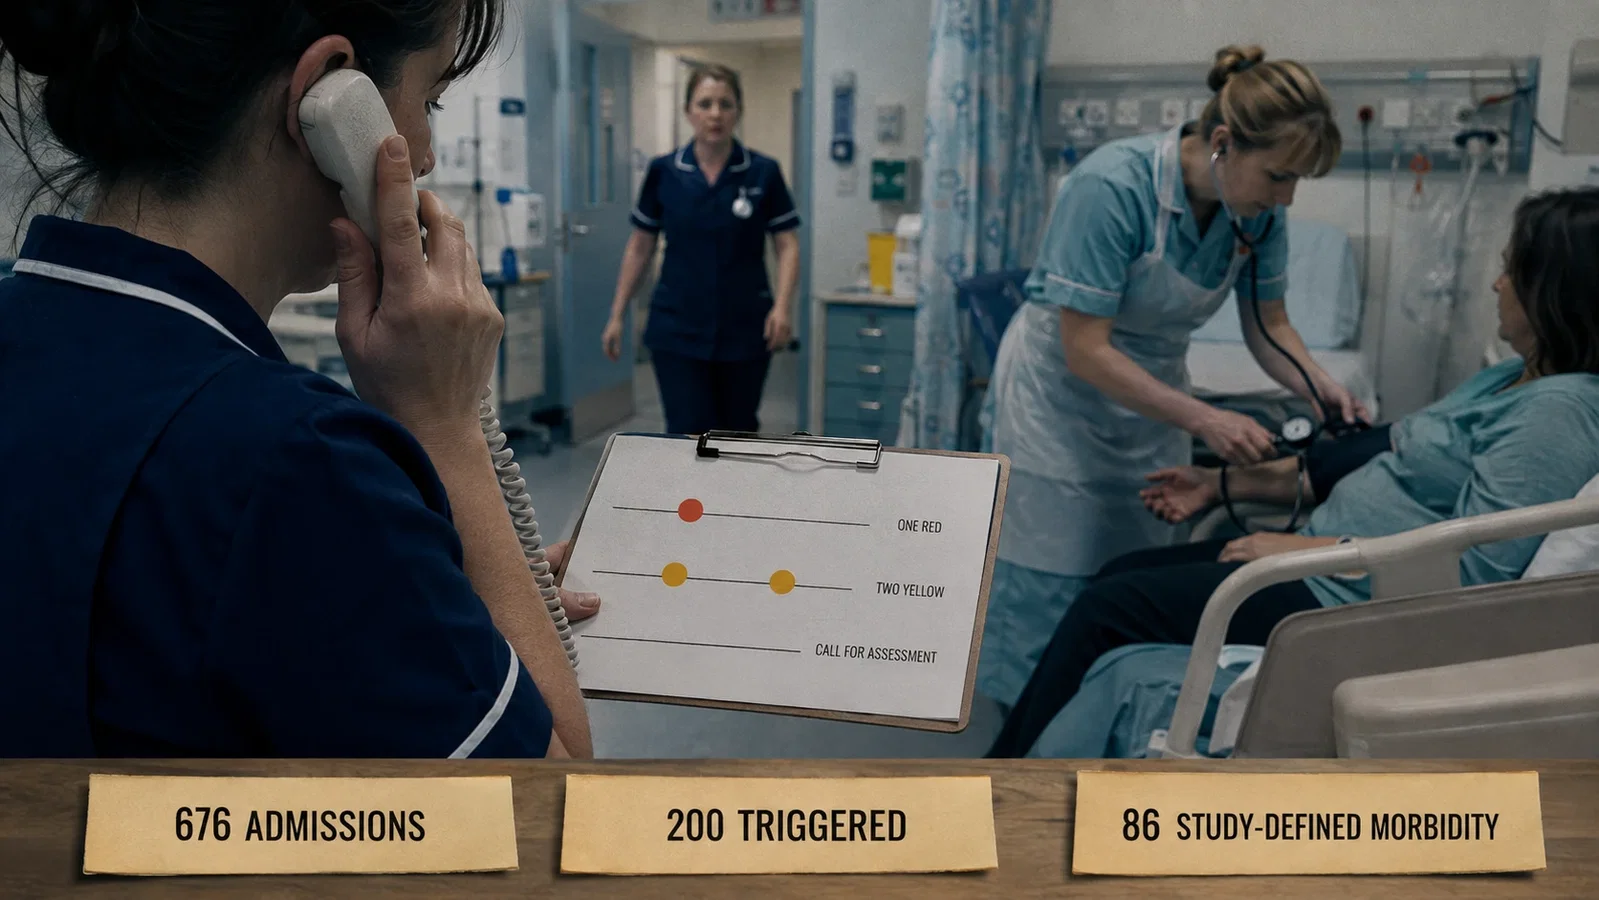
In a cohort of 676 obstetric admissions, 200 women triggered an early warning chart. Only 86 met the study's morbidity criteria.
Those two numbers contain the problem that Singh and colleagues tried to measure. A warning system must be sensitive enough to notice deterioration before it becomes unmistakable. Yet every trigger asks someone to repeat observations, examine a patient, consider a diagnosis, or escalate care. A system can miss too much, or it can call too often. It cannot be judged by the drama of a red mark alone.
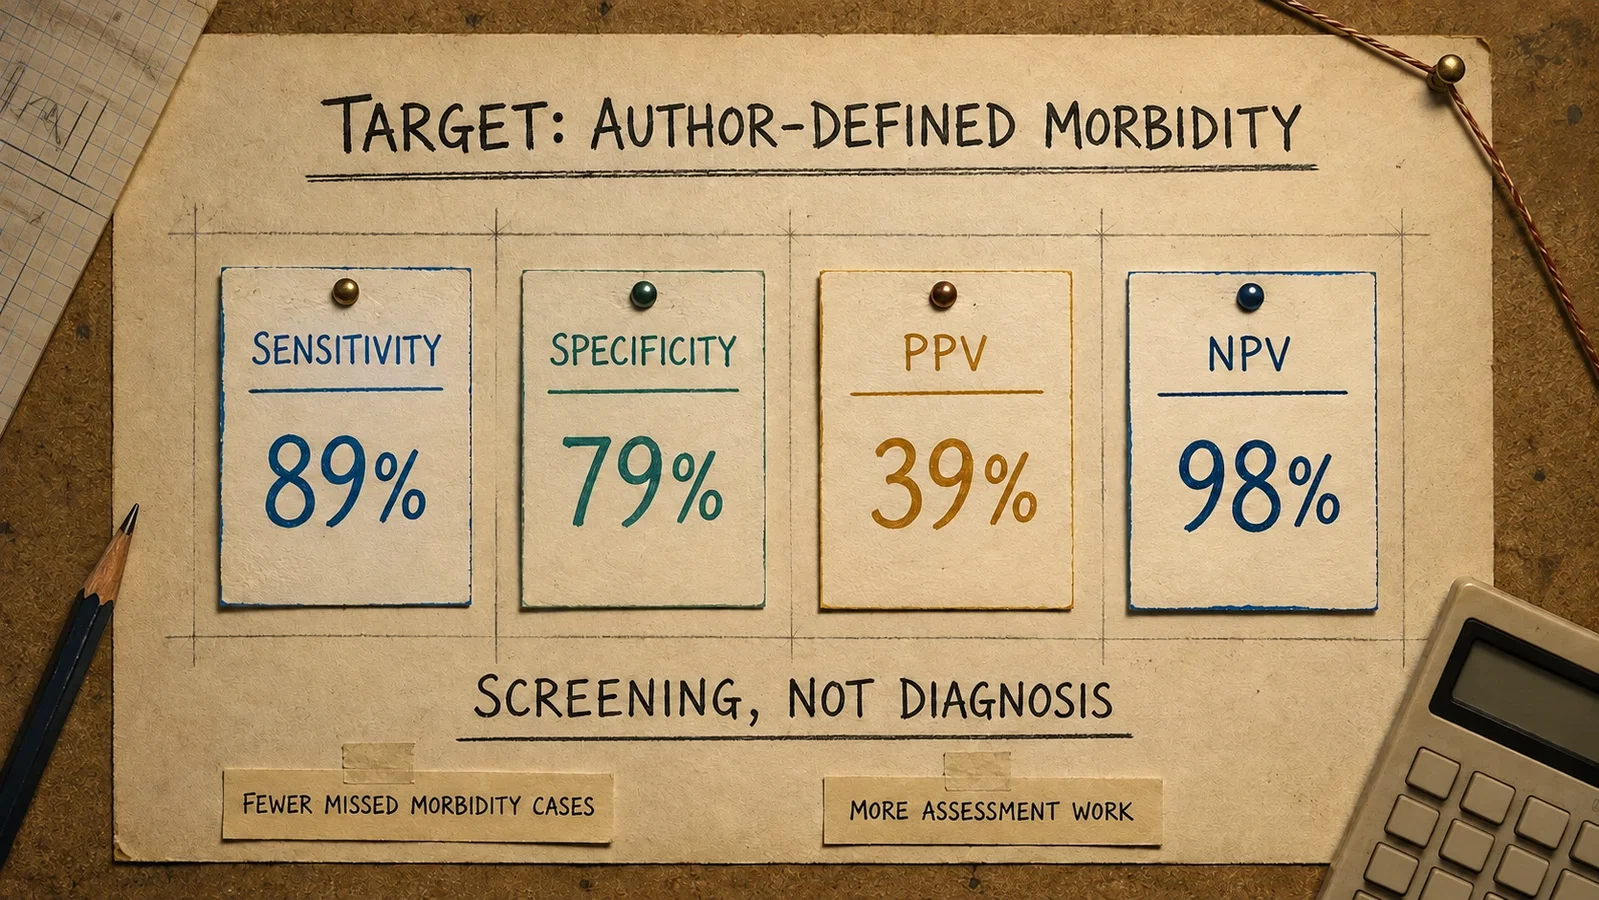
The study, published in Anaesthesia in 2012, reported 89% sensitivity, 79% specificity, 39% positive predictive value, and 98% negative predictive value. All four estimates referred to morbidity definitions agreed by the authors, in one UK tertiary referral centre, over two months. They did not measure whether the chart reduced death, intensive care admission, or morbidity.
That boundary is what makes this a useful historical article. Singh did not prove that MEOWS saved lives. The study made one part of a safety system measurable: whether a locally adapted chart identified a group more likely to meet a defined morbidity reference and therefore to need assessment.
What did "validation" mean here?
The unit being tested was not a universal MEOWS. It was one chart adapted from the system recommended by the Confidential Enquiry into Maternal and Child Health, or CEMACH, and already used in the study centre's routine care.
The investigators prospectively reviewed 676 consecutive obstetric inpatient admissions. Eligible patients ranged from 20 weeks' gestation to six weeks postpartum. Physiological observations were recorded on the chart at least every 12 hours. One markedly abnormal observation in a red zone, or two mildly abnormal observations in yellow zones at the same time, triggered urgent medical assessment.
The chart was the index test. The reference condition came from the patients' records and notes over 30 days. Before the study began, the authors agreed a set of morbidity criteria. They acknowledged that no universally accepted definition of obstetric morbidity was available and that some of their criteria were arbitrary.
That detail is not a minor methodological footnote. Sensitivity and predictive value do not exist in isolation. They describe performance against a particular reference condition. Here the target was study-defined morbidity, not a confirmed diagnosis of "deterioration" and not a patient outcome accepted across every hospital.
The records were nearly, but not perfectly, complete. Charts were available for 673 admissions; three missing charts were reconstructed from observations recorded in the notes. The authors called the work a prospective review and described it as the first study attempting to validate an obstetric early warning chart. That was their claim about the research question, not evidence that one national instrument had now been validated for all settings.
The recommendation came before the performance study
MEOWS did not begin with the 2012 paper. Its policy prelude was an inquiry into maternal deaths and missed physiological deterioration.
In December 2007, CEMACH's Saving Mothers' Lives report called for routine obstetric early warning charts. Until a national chart could be developed, it encouraged trusts to adopt existing modified systems. The recommendation extended beyond maternity wards: pregnant patients cared for in emergency, gynaecological, or critical care settings also needed pregnancy-appropriate observation.
The report explained why ordinary early warning scores could not be assumed to transfer unchanged. Pregnancy alters normal physiology. A useful obstetric chart therefore had to make deterioration visible without treating pregnancy itself as abnormal.
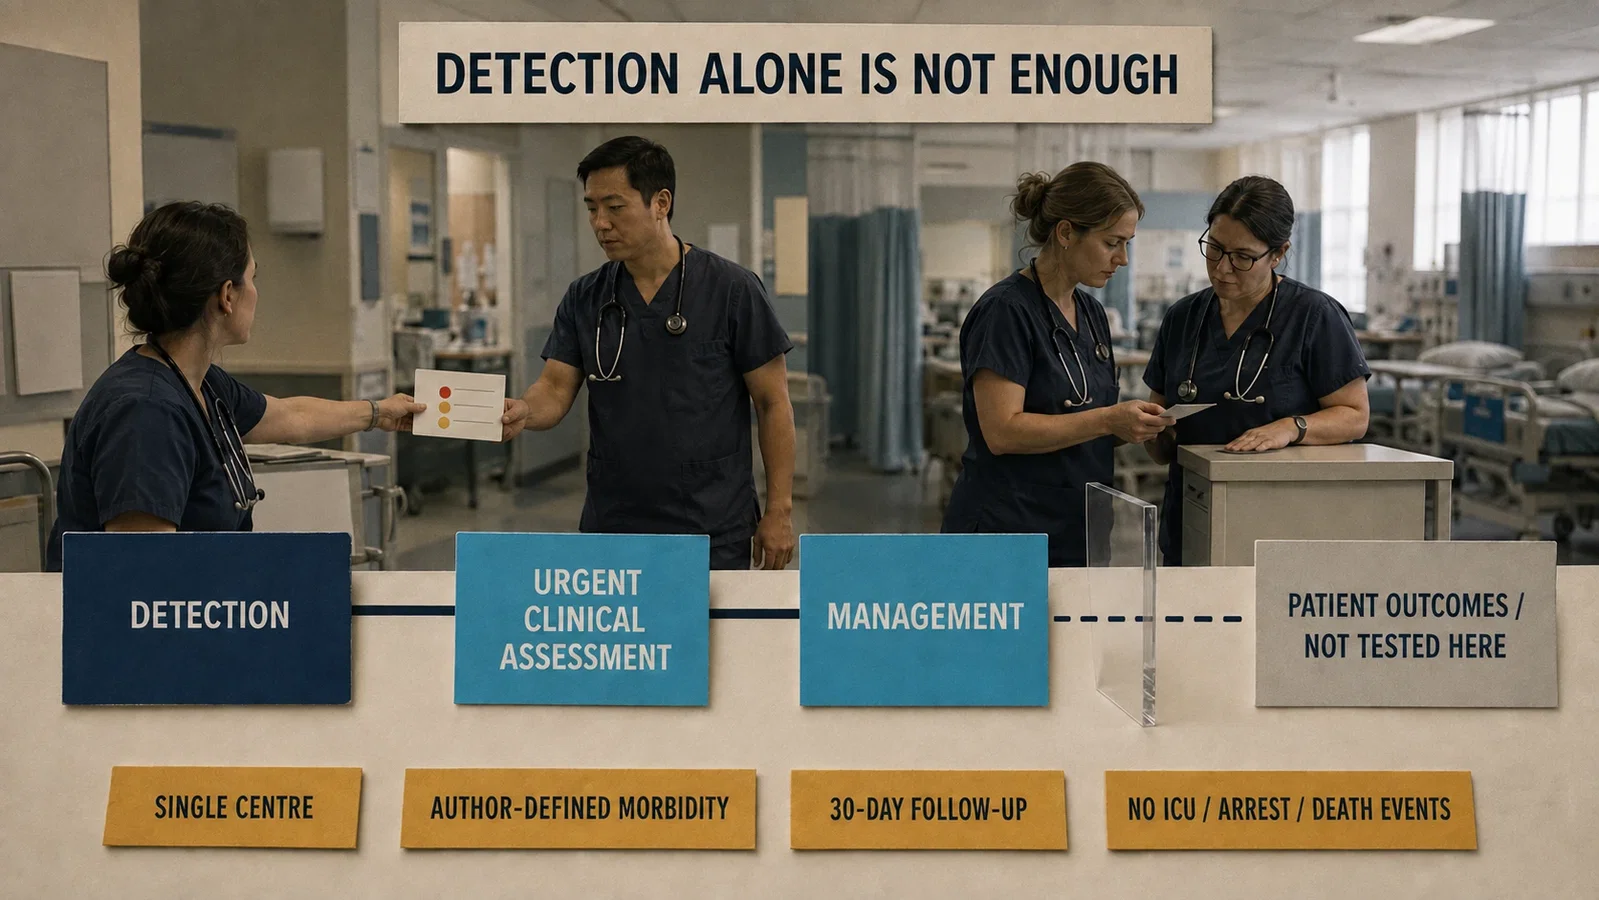
But CEMACH also stated the more important systems principle. Detection alone was of little value. What might change an outcome was the management that followed an abnormal score. The chart could begin a response; it could not substitute for one.
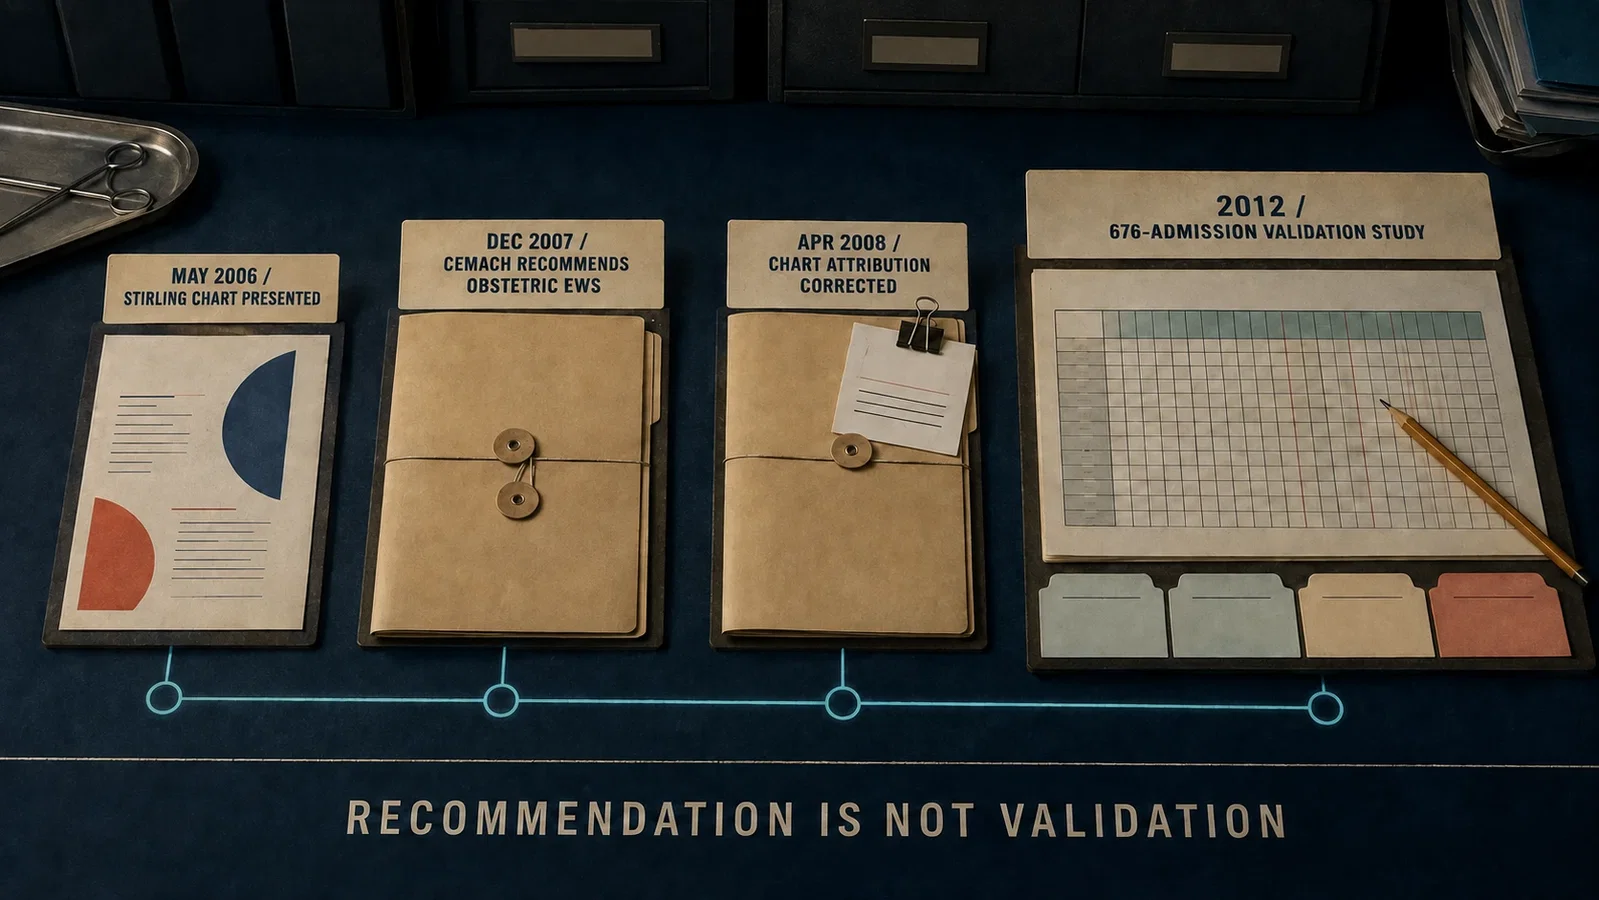
Even the chart's lineage required correction. An April 2008 CEMACH erratum clarified that the obstetric early warning chart used by Aberdeen Maternity Hospital had originally been developed at Stirling Royal Infirmary. P. Harrison, C. Hawe, and F. McIlveney had presented it at the Obstetric Anaesthetists' Association meeting in Glasgow in May 2006. A separately issued chart correction repeated that attribution.
The sequence therefore contains four different acts: a chart was presented in 2006, CEMACH recommended wider use of obstetric warning systems in 2007, the chart attribution was corrected in 2008, and Singh's validation study appeared in 2012. Collapsing them into a single invention story would erase the difference between tool development, policy recommendation, historical correction, and performance research.
Two hundred triggers and 86 morbidity cases
Of the 676 admissions, 200 triggered MEOWS, or 30%. Eighty-six, or 13%, met the authors' morbidity criteria.
The triggered group was clinically different from the group that did not trigger. Study-defined morbidity occurred in 39% of triggered patients and in fewer than 1% of non-triggered patients. Emergency obstetric intervention occurred in 46% versus 16%, and median hospital stay was three days versus one. Each comparison was reported with p<0.0001.
Among those who met the morbidity criteria, haemorrhage accounted for 43%, hypertensive disease of pregnancy for 31%, suspected infection for 20%, anaesthetic complications for 4%, and acute asthma for 2%. These are proportions within this study's morbidity group, not estimates of population incidence.
The commonest reasons for triggering were high blood pressure, at 42%, tachycardia, at 28%, and low blood pressure, at 18%. The authors questioned whether the low-blood-pressure threshold was appropriately set. That discussion shows that a chart can perform reasonably overall while an individual parameter may still generate excess false positives. It is a proposal for refinement, not a current threshold recommendation.
The observed associations were strong, but association is not intervention effect. A physiological abnormality could both trigger the chart and contribute to the morbidity definition. Clinical assessment and treatment after a trigger could then alter what happened next. The authors recognised that proximity between trigger criteria and outcomes might create a self-fulfilling effect. The chart, the patient's condition, the response, and the recorded outcome all sat within the same feedback loop.
Four percentages answer four different questions
Against the authors' morbidity reference, sensitivity was 89%, with a 95% confidence interval of 81% to 95%. Sensitivity asks: among the people who eventually entered the study-defined morbidity group, how many had triggered?
Specificity was 79%, with a 95% confidence interval of 76% to 82%. It asks: among those who did not enter that group, how many did not trigger?
Positive predictive value was 39%, with a 95% confidence interval of 32% to 46%. It starts with a positive trigger and asks how often the person belonged to the morbidity group. The value is not the chart's overall accuracy. Nor does it prove that every trigger outside the morbidity group was useless. An assessment can rule out illness, prompt repeat measurement, or identify a problem that the study's chosen definition does not capture.
Negative predictive value was 98%, with a 95% confidence interval of 96% to 99%. It starts with no trigger and asks how often the person remained outside the morbidity group. It is reassuring within this study population, but it is not a guarantee. Sensitivity was not 100%, follow-up was limited to 30 days, and patients treated elsewhere could have been missed.
High sensitivity and high negative predictive value can coexist with a modest positive predictive value because the measures answer different questions and predictive values depend on prevalence. When the target condition is relatively uncommon, a sensitive screening system may produce many more calls than eventual morbidity classifications.
Singh and colleagues treated that balance as a design choice. A false negative in obstetric care might have catastrophic consequences. False positives, however, could increase workload, cost, investigation, and patient anxiety. The aim was not to make the chart quiet. It was to decide what burden of assessment was justified by the danger of missing deterioration.
This is also why MEOWS was a screening tool rather than a diagnostic test. A red or yellow trigger identified someone who required clinical review. It did not name a disease, determine treatment, or confirm that deterioration had occurred.
Zero events do not demonstrate an outcome benefit
There were no intensive care admissions, cardiorespiratory arrests, or deaths during the study period. That absence can sound reassuring, but it prevented the study from evaluating those outcomes. A cohort with zero deaths cannot show that the chart reduced mortality; it also cannot estimate how well the chart predicted death.
An outcome-effect question would require a different design. Researchers would need a meaningful comparison between care with and without a defined warning-and-response system, enough events to detect a difference, control for case mix, clear documentation of what happened after each trigger, and reliable surveillance for outcomes. Singh's study was not such a trial.
Its other limits point in the same direction. This was a single tertiary referral population. Thirty-day follow-up relied on hospital records and could miss care delivered elsewhere. The reference standard was author-defined and partly arbitrary. Some trigger thresholds lay close to components of the morbidity definition. Results from this chart, in this centre, cannot be assumed to describe every version of MEOWS or every obstetric population.
The publisher later issued a correction, but it changed only the corresponding author's email address. It did not alter the methods, results, or scientific interpretation.
What the later evidence did, and did not, settle
A 2019 systematic review by Umar and colleagues placed the study inside a broader obstetric early warning literature. The reviewers identified 381 records and included 17 studies. They found 16 published EWS versions. No randomised trial was identified; predictive-accuracy studies were observational, while most studies of clinical effectiveness used quasi-experimental designs. Because tools and outcomes were heterogeneous, the authors used narrative synthesis rather than treating every system as one interchangeable intervention.
In studies of general obstetric populations, median sensitivity for morbidity or intensive care admission was 89%, median specificity 85%, and median positive predictive value 41%. The review's table preserved Singh's original row: 676 admissions, 200 triggers, 86 morbidity cases, and the same 89%, 79%, 39%, and 98% estimates. The later medians provide context. They do not replace the 2012 study or validate one universal chart.
The review also made the operational cost of low positive predictive value explicit. Positive screens in people who did not reach a study outcome could consume resources, create nuisance alarms, and contribute to alarm fatigue. An early warning system had to be used with clinical judgment, not instead of it.
Evidence about mortality remained limited. The review found no randomised trials and stated that one small, low-quality study offered no evidence that early warning systems reduced maternal deaths. More robust studies were needed to assess that outcome across settings.
That conclusion did not erase the importance of Singh's study. It divided the broad claim that a chart is "useful" into testable layers. Does it identify a group at higher risk? Does a trigger produce a timely response? Is that response clinically appropriate? Does the complete system change patient outcomes? Each question needs its own evidence.
The historical subject is the response chain
MEOWS turned bedside observations into a shared signal. Colour made deviation visible. A trigger rule reduced the need for a clinician to rely on hesitation or hierarchy before calling for help. A callout algorithm specified that someone should respond.
Yet the chart could not complete the safety process. CEMACH had already drawn the boundary: detection alone is not enough. The signal must be checked, interpreted, and connected to a team capable of acting.
Singh and colleagues quantified one link in that chain. In one centre, 676 admissions produced 200 triggers and 86 study-defined morbidity cases. Sensitivity of 89%, specificity of 79%, positive predictive value of 39%, and negative predictive value of 98% described a sensitive screening tool with a substantial assessment burden. They did not cross the evidentiary gate to patient-outcome benefit.
One red observation, or two yellow observations together, could start a call. The historical significance of that call depended on what happened at the other end of the line.
Sources and reading limits
Sources: Singh S, McGlennan A, England A, Simons R. Anaesthesia. 2012;67(1):12-18. PMID 22066604. DOI 10.1111/j.1365-2044.2011.06896.x; CEMACH. Saving Mothers' Lives 2003-2005. December 2007, Chapter 19 and official 2008 errata/chart records; Singh et al. publisher correction. Anaesthesia. 2012;67:453. DOI 10.1111/j.1365-2044.2012.07131.x; Umar A, Ameh CA, Muriithi F, Mathai M. PLoS One. 2019;14:e0217864. PMID 31150513. PMCID PMC6544303. DOI 10.1371/journal.pone.0217864. All cited sources were read for this article.
Visual interpretations
These illustrations explore the setting and ideas. Depicted people, actions, instruments and documents are reconstructions, not evidence of their exact historical appearance.
Continue exploring
Related reading connects shared questions and contexts; it does not by itself establish historical influence.
The Source Room · About & Editorial Method
Sources and reading limits are stated above. Illustrations are labelled as original source images or AI-made. Historical accounts are educational; they are not current treatment instructions.