In 1850 Hoffa and Ludwig published a lever tracing of a rabbit heart moving irregularly under electrical stimulation, together with the method and conditions that produced it.
Reading Library · Anesthesia Epochs · 中文版
Watch the education video (for clinicians)
1850: Hoffa and Ludwig — What an Irregular Line Recorded · Anesthesia Epochs Education Series
A fine line rises and falls unevenly, with changes in both timing and amplitude. In Hoffa and Ludwig's report it is figure 19: a record made through a lever as a rabbit's heart was electrically stimulated.[1, pp. 129, 144; plate III]
The line deserves close attention, but a modern name should not replace the account of how it was obtained. It records mechanical movement. The apparatus, conditions of stimulation and authors' own questions are part of the evidence.
The regularity they had hoped to find
At the beginning of the paper, Ludwig recalls an expectation that had not been fulfilled. Further experiments were supposed to establish a regular relationship between the durations of cardiac contraction and relaxation. Disappointed, Ludwig had set the material aside. Hoffa reviewed it again and added experiments, helping bring the work to publication.[1, p. 107; signature on p. 116]
The investigation began with questions about how the heart moved and how that movement could be measured. Its later placement in a history of defibrillation should not be substituted for the investigators' stated purpose.
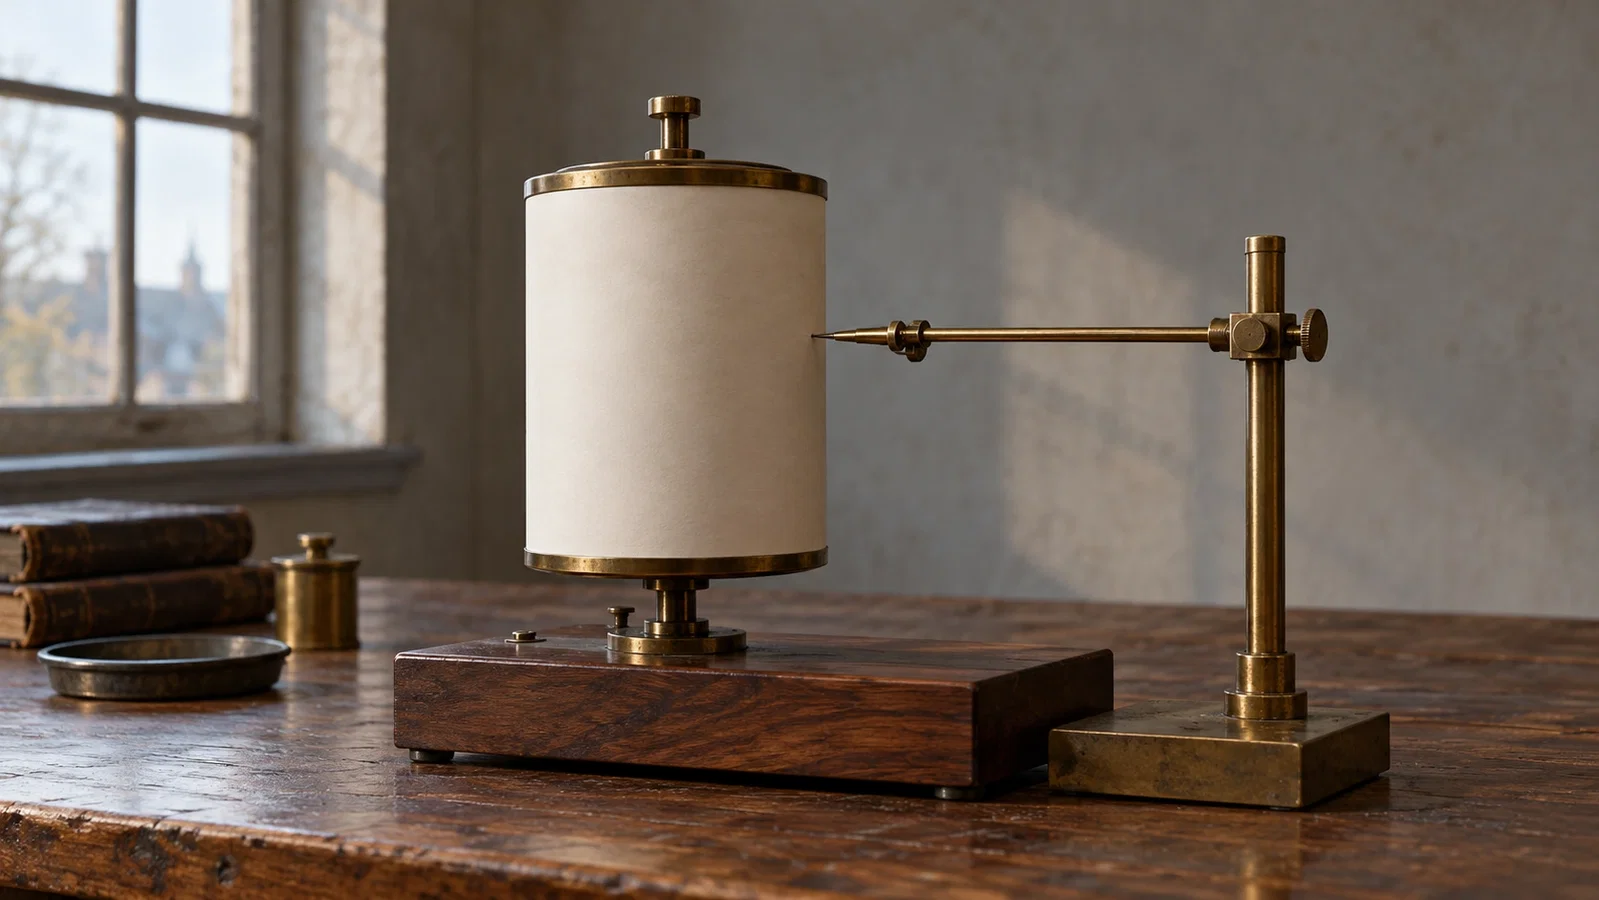
A lever in contact with the heart moved a pen that inscribed a curve on paper carried by a drum. The paper discusses the method's limitations: contact between the lever and heart had to be maintained, and different parts might not move simultaneously.[1, pp. 108–111; plate III, figure 1] This recording method also makes clear that figure 19 is not a modern electrocardiogram.
What moved after electrical stimulation
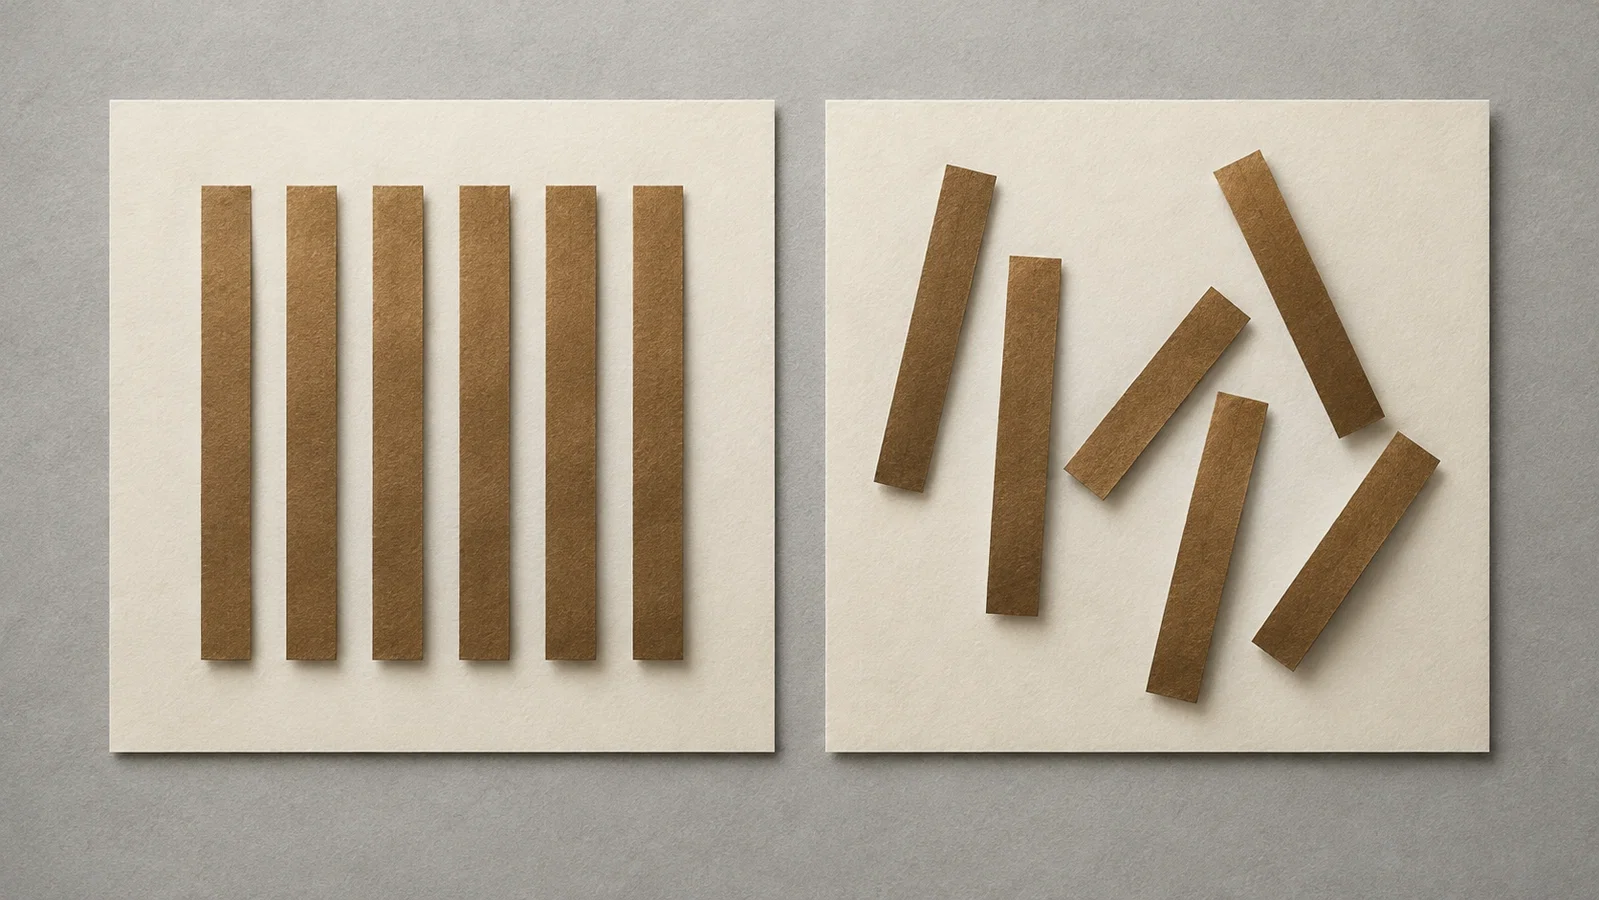
In their discussion of electrical stimulation, the authors distinguish local sustained contraction near the electrode wires from very rapid, irregular movements of low intensity elsewhere. They explain the disorder in terms of parts losing the simultaneity of their contractions. That is their interpretation, not a direct measurement of a modern cellular mechanism.[1, pp. 128–129]
Figure 19 supplies a specific example. The authors report 84 movements in a segment lasting 8.34 seconds and convert that count into a rate per minute.[1, p. 129] These are their reported observations of a mechanical trace. This article has not independently recounted the deflections, and the count cannot be treated as 84 effective pumping actions or as the result of modern electrocardiographic diagnosis.
The legend on page 144 identifies a rabbit's heart, a lever recording and electrical stimulation during the tracing. Reading the figure with its discussion and legend establishes what the irregular line represents.[1, p. 144; plate III, figure 19]
Recovery in an experiment is not a report of defibrillation treatment
The authors describe irregular movements continuing after stimulation had ended. Increasing numbers of parts ceased their rapid movements; a general pause followed, then a strong coordinated movement restarted the normal rhythm.[1, pp. 129–130]
That passage does not attribute recovery to another therapeutic electric shock. Nor is it a report of successful human resuscitation. Observing irregular movement in an animal experiment and following what happens afterward are different evidentiary tasks from demonstrating a clinical method of defibrillation.
A specific comparison can be made with the earlier Erichsen article. In 1842, under altered cardiac vascular conditions, Erichsen described slight tremulous movement after regular ventricular action had ceased, while the auricles continued to act.[2, p. 563] Hoffa and Ludwig here examined movement under electrical stimulation and recorded it mechanically. Reading the reports alongside one another preserves their different experimental conditions; it does not establish direct influence between the authors.

Figure 19 matters for more than its disorderly appearance. The original explains how the trace was produced, how its authors described it, and why a line alone cannot carry every later conclusion placed upon it.
Sources and reading limits
Read: Hoffa and Ludwig's paper at pp. 107–111, 116, 128–131 and 144, with the volume title page and plates III–IV; Erichsen's 1842 paper, p. 563, for the comparison.
Not covered: the rest of the 38-page paper; the specific dates of the experiments (the volume title page gives 1850; an 1849 date is not supported by the pages read); the later history of electrical resuscitation and any priority question about fibrillation or defibrillation.
The four illustrations are modern AI-made imaginings, not the authors' apparatus or figure 19.
- M. Hoffa, C. Ludwig. Einige neue Versuche über Herzbewegung. Zeitschrift für rationelle Medicin. 1850;9:107–144, plates III–IV. Internet Archive
- John E. Erichsen. On the Influence of the Coronary Circulation on the Action of the Heart. London Medical Gazette. 1842; new series II:561–564. Internet Archive
Continue exploring
Related reading connects shared questions and contexts; it does not by itself establish historical influence.
Anesthesia Epochs · The Source Room · About & Editorial Method
Updated October 30, 2026. Sources and reading limits are stated above. Illustrations are labelled as original source images or AI-made. Historical accounts are educational; they are not current treatment instructions.