In 2008, lung artefacts, sliding, PLAPS, and venous analysis became a sub-three-minute bedside pathway for acute respiratory failure.
Reading Library · Anesthesia Epochs · 中文版
Watch the companion film
2008: Lichtenstein — The BLUE Protocol for Lung Ultrasound · Watch on YouTube
Historical anchor: 2008. Date details and source qualifications are explained below.
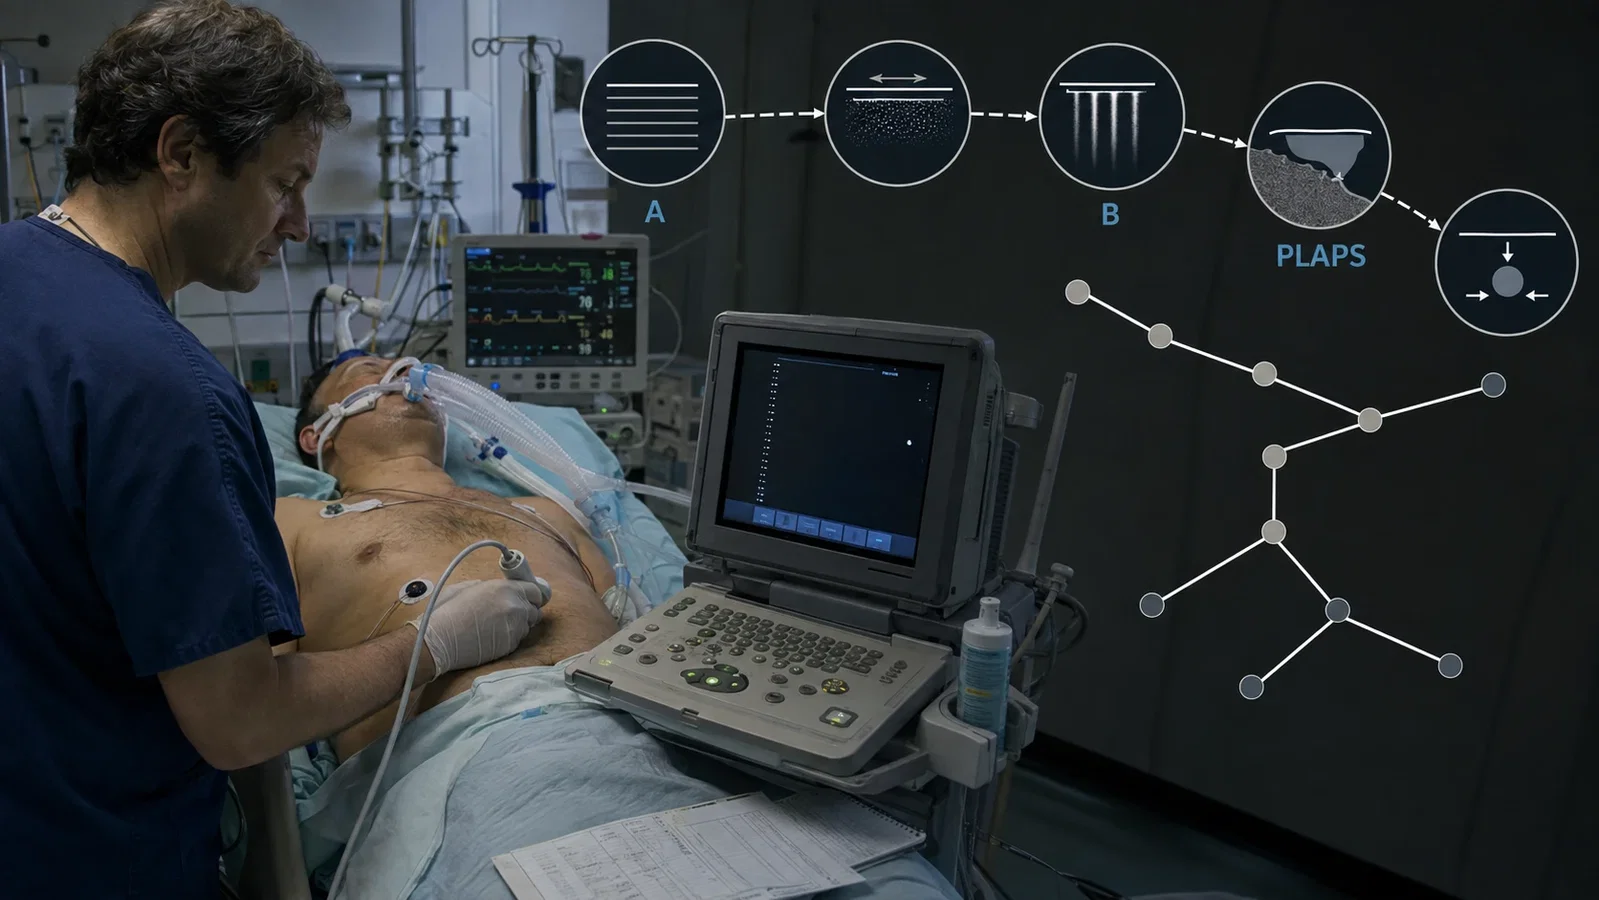
Ultrasound usually rewards the operator with anatomy. The lung seemed to break that bargain. Air blocked the beam, leaving repeated horizontal lines, bright vertical streaks, and moving interfaces where a conventional organ image ought to have been. For years, such artefacts could look like evidence of failure.
The BLUE protocol made a different proposition: the failure pattern was itself information. The decisive unit was not a beautiful image or a new machine. It was a sequence. Place the probe in defined regions, decide which signs coexist, group them into a profile, and let that profile determine the next examination step.
Daniel Lichtenstein and Gilbert Mezière's paper appeared online in CHEST on 10 April 2008 and in print that July. BLUE stood for Bedside Lung Ultrasound in Emergency. The paper did not introduce the first use of ultrasound on the lung, nor did it establish perioperative point-of-care ultrasound in one stroke. It organised accumulated bedside signs into a named diagnostic pathway for adults arriving in intensive care with acute respiratory failure.
I. A Protocol Is a Series of Movements
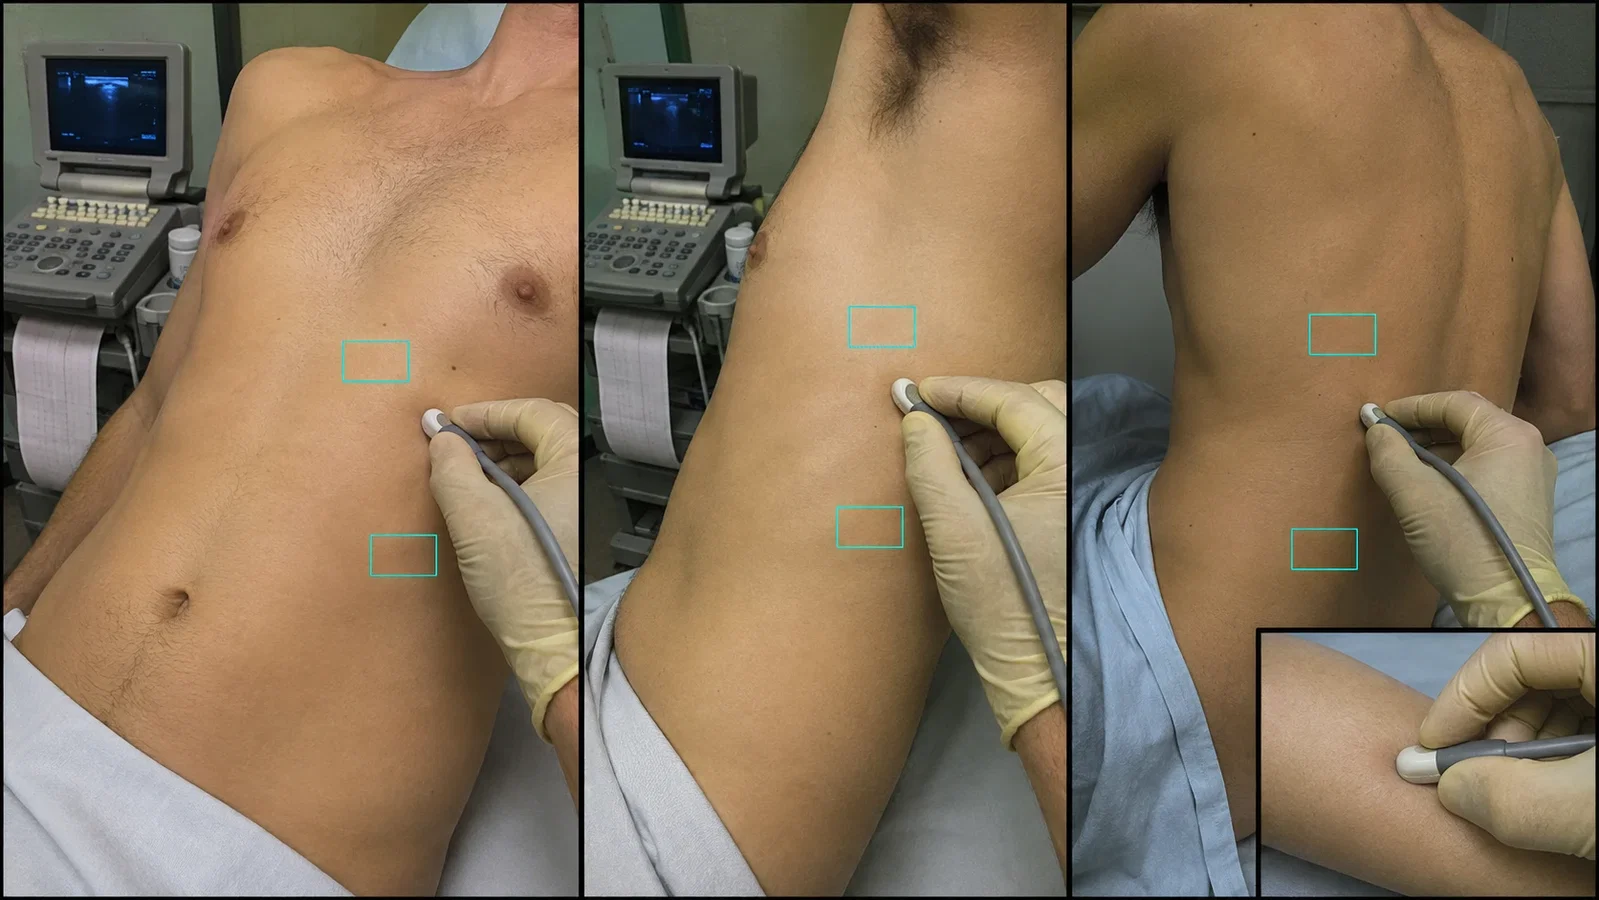
The study took place in university-affiliated intensive care units in Boulogne and Saint-Cloud, Paris-Ouest. The investigators used a Hitachi-405 with a 5-MHz microconvex probe. Patients were examined semirecumbent, or supine when intubated. The probe moved longitudinally between the ribs.
The examination had three geographic stages. It began at the anterior chest, extended to the lateral wall, and then reached the dependent posterolateral region while the patient was moved as little as possible. Each stage was divided into upper and lower areas, producing six investigation areas. The same short probe was also used to test venous compressibility and look for thrombosis.
That sequence matters more than the brand of the machine. It joined an anterior survey of artefacts, lung sliding, and consolidation to a posterolateral search for alveolar or pleural abnormalities, then added venous analysis when the profile required it. The examination was performed within 20 minutes of ICU admission, without interrupting management, and took less than 3 minutes in the study.
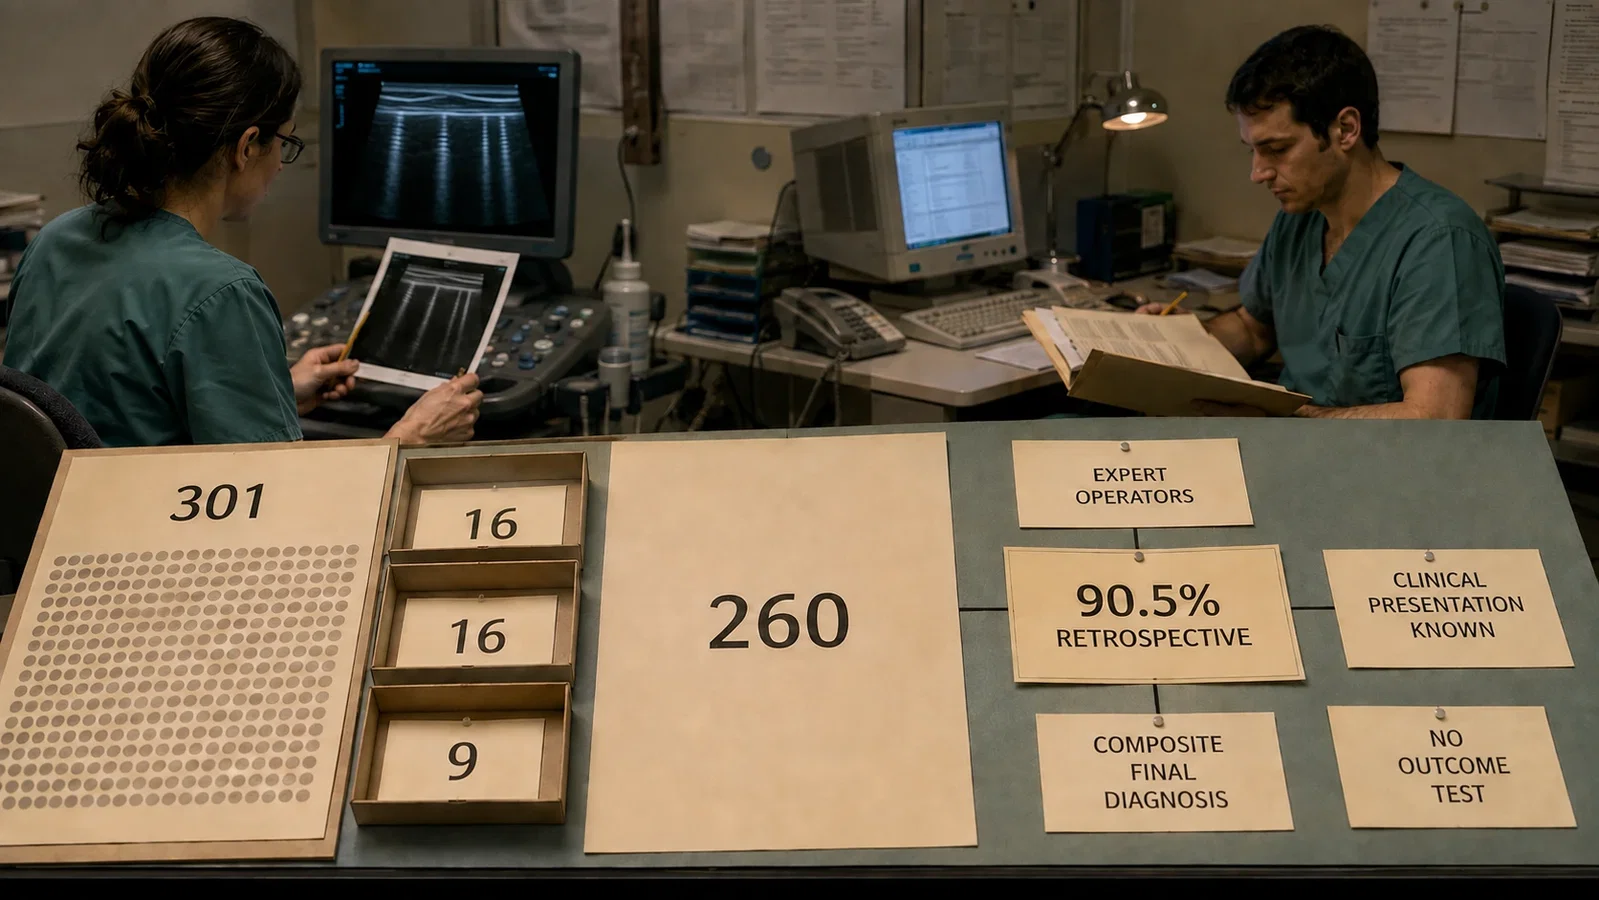
The speed should not be detached from the operators. Both investigators had several years of ultrasound experience. They did not manage the patients, but they knew the clinical presentation. The paper did not test whether a novice could learn or reproduce the same examination in three minutes.
II. Signs Had to Become Sentences
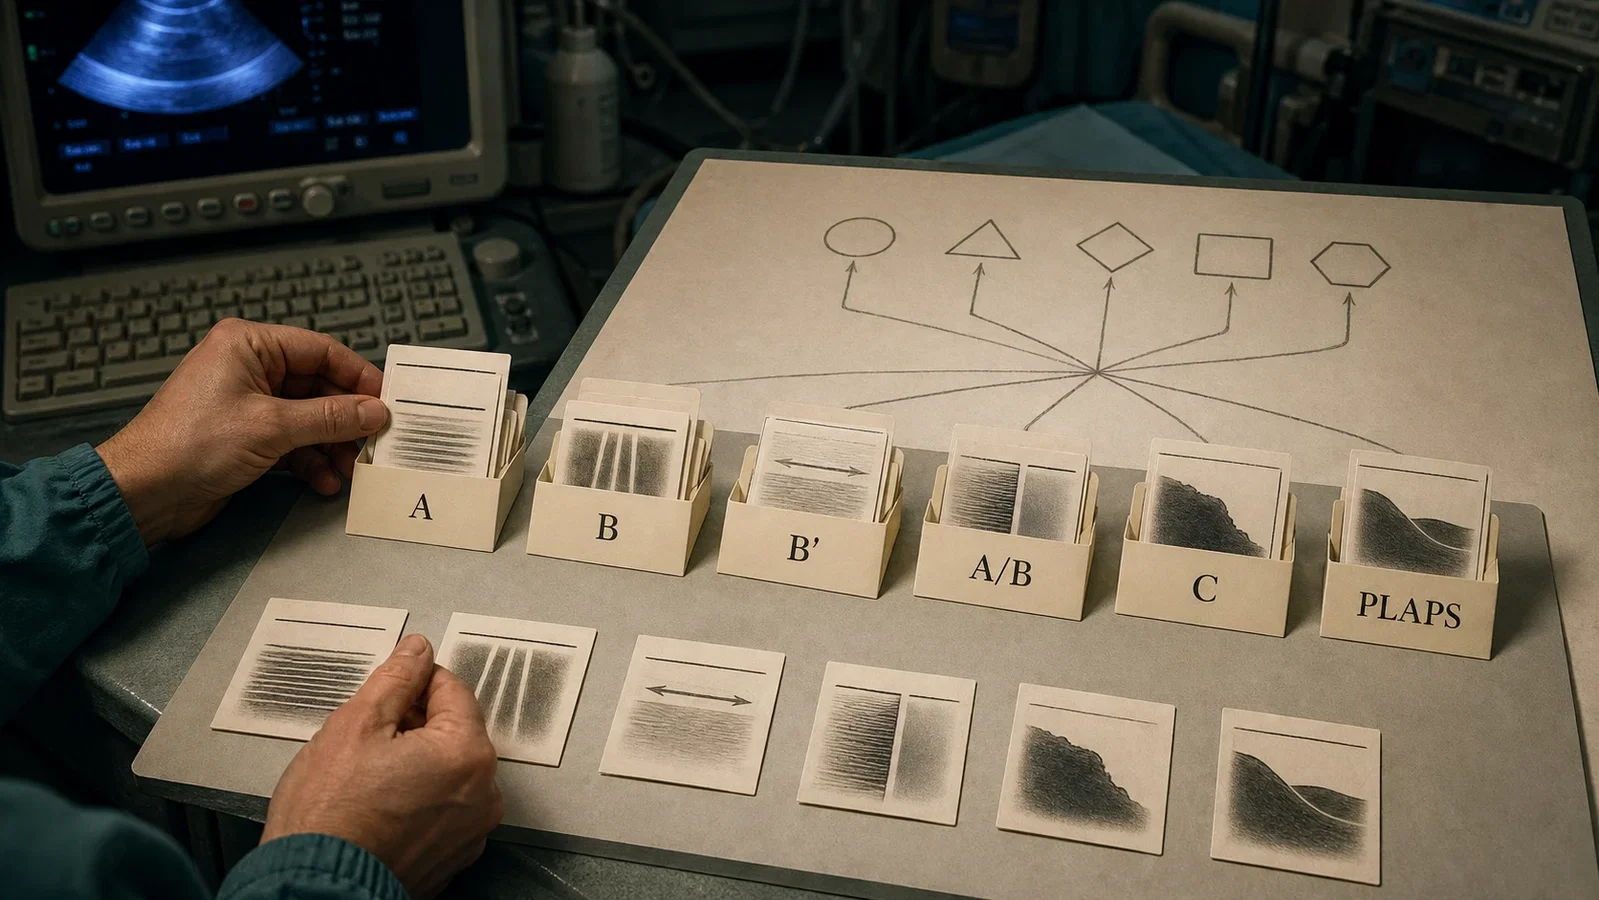
An A line was a horizontal repetition arising from the pleural line. A B line was vertical, bright, well defined, extended to the far edge of the screen, erased A lines, and moved with lung sliding when sliding was present. Three or more B lines in one view were called B+ lines. Lung sliding described movement of visceral against parietal pleura. A lung point marked a local transition between sliding and absent sliding. Consolidation and pleural effusion supplied other kinds of tissue and fluid information.
None of those signs alone was the protocol. BLUE combined them into profiles.
Predominant bilateral anterior A lines with lung sliding formed the A profile. Bilateral anterior B+ lines with sliding formed the B profile; loss of sliding changed it to B′. B+ lines on one side and A lines on the other formed an A/B profile. An anterior consolidation formed the C profile. Posterior or lateral alveolar and pleural abnormalities were grouped as PLAPS, the posterolateral alveolar and/or pleural syndrome.
The distinction is grammatical as much as technical. A sign is a word. A profile is a short sentence made from several words. The decision tree acts on the sentence, not on an isolated streak on the screen.
III. The Tree Preserved the Next Question
The proposed algorithm began with anterior lung sliding. When sliding was present, pneumothorax became less likely. The operator then looked for anterior B lines. A B profile suggested cardiogenic pulmonary oedema. B′, A/B, and C profiles suggested pneumonia.
An A profile did not end the examination. It triggered venous analysis. An A profile with venous thrombosis pointed towards pulmonary embolism. If the veins were free, the operator looked for PLAPS. A profile plus PLAPS suggested pneumonia; an A profile without PLAPS, the normal profile, suggested COPD or asthma. The tree grouped COPD and asthma together. It did not distinguish one from the other.
When anterior sliding was absent, A lines plus a lung point pointed towards pneumothorax. Without a lung point, the original tree retained an exit to other diagnostic modalities. Cardiac ultrasound was not a node in this lung-ultrasound algorithm. The authors explained that lung ultrasound offered direct clues to the respiratory problem, while noting that cardiac analysis completed their approach in practice.
The structure therefore preserved uncertainty better than a slogan would. It specified which observation should lead to which next question. It did not claim that a machine supplied a diagnosis automatically or that one sign could replace the rest of the clinical assessment.
IV. Put the Denominator Before 90.5 Percent
Over a four-year study period, the investigators enrolled 301 consecutive adults with acute respiratory failure. The accuracy analysis did not include all 301. Sixteen patients never received a definite diagnosis, 16 had several official diagnoses, and 9 had causes occurring in less than 2 percent of the cohort. Removing those 41 patients left 260 with one definite final diagnosis.
The ICU team established that diagnosis without access to the research lung-ultrasound result. It used history, examination, radiography, CT when available, disease-specific tests, and response to treatment. CT was available in 38 patients, not uniformly across the cohort. The clinicians managing the patients were blinded to the ultrasound findings, and the ultrasound investigators did not participate in management. This separation reduced one source of bias, but it did not create a double-blind study with one CT reference standard for every disease.
Within the 260 analysed patients, the B profile had 97 percent sensitivity and 95 percent specificity for cardiogenic pulmonary oedema. The normal profile had 89 percent sensitivity and 97 percent specificity for COPD or asthma. The A profile plus venous thrombosis had 81 percent sensitivity and 99 percent specificity for pulmonary embolism. The combined pneumonia profiles had 89 percent sensitivity and 94 percent specificity.
When the authors applied the whole decision tree to these cases, it would have retrospectively produced the correct diagnosis in 90.5 percent. Every part of that sentence carries weight. It was the proposed tree, applied retrospectively, within the selected 260-patient analysis. There was no contemporaneous control group receiving conventional diagnosis alone. The study did not test whether using BLUE reduced CT, changed treatment, shortened an ICU stay, or improved survival.
The result remained clinically interesting. It was not a universal accuracy guarantee.
V. The Abstract Was Not the Last Word
Reading the complete article also reveals why a prominent number should never be lifted without checking its table and correction history.
In the 2008 PDF, the pulmonary-embolism subsection opens with the erroneous statement that pulmonary oedema was observed in 21 patients. CHEST issued a formal correction in 2013. The corrected passage identifies pulmonary embolism, then reports that 20 of the 21 patients had anterior-predominant A lines with lung sliding, one had anterior consolidation with absent sliding, 11 had PLAPS, and 17 had venous thrombosis. The correction, not the unamended PDF sentence, controls that paragraph.
A second discrepancy remains unresolved. The abstract reports 81 percent sensitivity for the pneumothorax profile. Table 4 and the body report 88 percent, based on 8 detections among 9 patients, which is 88.9 percent before rounding. The 2013 notice corrected a different error and did not reconcile these values. For that reason, this account does not select one pneumothorax sensitivity and present it as uncontested. The sign combination and the reported 100 percent specificity can be described, but the sensitivity has two versions in the source.
The authors' own limitations sharpen the same lesson. Experienced operators knew the clinical presentation. The exclusions removed uncertain, multiple, and rare diagnoses, precisely the cases that often complicate real practice. Pulmonary oedema versus interstitial pneumonia and pulmonary embolism without venous thrombosis were identified problem areas. Equipment also mattered. A system designed to suppress artefacts could erase the very information lung ultrasound required, and not every probe offered suitable resolution, depth, or ergonomics.
VI. An Anaesthesiology Connection Without a Perioperative Rewrite
The 2008 cohort belonged to critical care, not to an operating room, preoperative clinic, or post-anaesthesia care unit. Calling it proof that perioperative POCUS had been established in 2008 would project later practice back into a study that did not evaluate it.
This article still has a legitimate place beside anaesthesia history. In 2004, Lichtenstein and colleagues had published a prospective comparison in Anesthesiology. The PubMed abstract describes 32 patients with ARDS and 10 healthy volunteers, with auscultation, bedside chest radiography, and lung ultrasound compared against thoracic CT. It separately reports 384 lung regions, 12 per patient. The first author's affiliation was a Department of Anesthesiology. That record shows that lung ultrasound already occupied a shared anaesthesiology and critical-care research space before the BLUE name appeared. Because the publisher body was not accessible, no body-only claim from that article is used here.
BLUE's 2008 contribution was narrower and more precise than a claim of instant adoption. It turned probe movement into a reproducible order, artefacts into a vocabulary, signs into profiles, and profiles into explicit next questions. It did not abolish CT, cardiac ultrasound, or clinical judgment. It made bedside images behave like an algorithm.
Ultrasound signals can answer different questions
BLUE permits a specific methodological comparison with 1982: Aaslid Records Arterial Velocity Through the Skull. In 1982, Aaslid and colleagues discussed attenuation by the skull and used an acoustic route to record cerebral arterial velocity from Doppler signals.[Additional comparison,p. 769] The 2008 BLUE report instead grouped lung artifacts, sliding and consolidation into profiles, with Figure 7 organizing the next diagnostic questions.[Original paper,pp. 117,123] This related link compares which signal supplies which information. It asserts no citation or transmission between the studies and does not equate arterial velocity with a lung diagnostic profile.
Additional comparison: Aaslid R, Markwalder TM, Nornes H. Noninvasive transcranial Doppler ultrasound recording of flow velocity in basal cerebral arteries. J Neurosurg.1982;57:769–774. Only page 769 read; BLUE pages 117 and 123 were consulted for the comparison. No new clinical-performance conclusion is drawn.
Sources and reading limits
Sources: Lichtenstein DA, Mezière GA. CHEST. 2008;134(1):117-125. DOI 10.1378/chest.07-2800; CHEST correction. 2013;144(2):721. DOI 10.1378/chest.13-1508; Lichtenstein et al. Anesthesiology. 2004;100(1):9-15. PMID 14695718. The complete 2008 article and all figures and tables were read. The 2004 record is used at abstract level because publisher full text was inaccessible.
Visual interpretations
These illustrations explore the setting and ideas. Depicted people, actions, instruments and documents are reconstructions, not evidence of their exact historical appearance.
Continue exploring
Related reading connects shared questions and contexts; it does not by itself establish historical influence.
The Source Room · About & Editorial Method
Sources and reading limits are stated above. Illustrations are labelled as original source images or AI-made. Historical accounts are educational; they are not current treatment instructions.