Validation, limitations and later versions of the original seven-category CFS.
Reading Library · Anesthesia Epochs · 中文版
Watch the companion film
2005: Rockwood — The Clinical Frailty Scale · Watch on YouTube
Historical anchor: 2005. Date details and source qualifications are explained below.
30 August 2005 · Validation of a seven-category scale
Age and a list of diagnoses do not directly describe how an older person manages daily life or how much help they need. On 30 August 2005, Kenneth Rockwood, Xiaowei Song and colleagues published their Clinical Frailty Scale (CFS) study in CMAJ. Seven categories summarized judgments made after clinical assessment, allowing the investigators to examine their prognostic value.[1, Introduction; Methods]
The assessments preceded publication. Clinical re-examinations in the second Canadian Study of Health and Aging (CSHA-2) began in 1996. The study included 2,305 participants, with CFS ratings missing for eight. Follow-up examined survival and entry into institutional care. Participants came from community and institutional settings; this was an observational study, not an anaesthesia or surgical trial.[1, Methods; Table 1]
The CFS summarized assessment rather than adding up seven questions. The paper also examined a Frailty Index constructed from 70 health deficits. 2001: Fried's Frailty Phenotype Makes a Clinical Concept Measurable used a different structure: unintentional weight loss, exhaustion, grip strength, walking speed and physical activity. These approaches required specified information, but their scores were not interchangeable.[1, Introduction; Boxes 1–2;5, pp.M146,M149]
CFS and Frailty Index scores correlated at 0.80. CFS categories were associated with subsequent mortality and entry into institutional care; its area under the ROC curve for approximately 70-month mortality was 0.70. This was neither a mortality percentage nor evidence that assigning a score improves survival. The function scale performed better for institutional entry, so the study did not establish universal superiority.[1, Results; Table 3]
Generalization required caution. The clinical sample overrepresented cognitive impairment and institutional residence. The team rating included the original physician and was unblinded to the first score, limiting what its agreement estimate could establish about independent ratings in everyday practice.[1, Methods; Interpretation]
The version matters too. Category 7 in 2005 included both complete dependence and terminal illness, a distinction the authors themselves questioned. Dalhousie's research group dates expansion to nine categories to 2007, followed by revisions to labels and descriptions in 2020. A later nine-category chart can cite the 2005 paper without being the chart published in that paper.[1, Box 1; Interpretation;2]
In a 2006 letter, family physician Doug Duke worried that a classification might persist even when a person's health improved. Rockwood, MacKnight and Bergman acknowledged the concerns about complex care and fairness. They defended a practical classification as a way to help match care to need. The exchange records a debate about use; neither the criticism nor the reply is an intervention trial.[3–4]
The connection to perioperative assessment requires attention to the instrument. 2010: Makary's Five-Item Study Brings Frailty into Preoperative Assessment used the five-characteristic phenotype in 594 elective surgical patients, grouping scores as 0–1, 2–3 and 4–5. Its methods and references point to Fried's work. Comparing it with CFS clarifies different approaches to older patients' vulnerability; it does not make that surgical study a validation of the seven-category CFS.[6, pp.901–903,908]
The 2005 report made an overall clinical judgment available for comparison and follow-up testing. Its historical contribution is best understood alongside the original seven-category version, the limits of observational validation and the questions its authors and readers raised.[1, Interpretation;3–4]
Images

Modern editorial reconstruction of a mid-1990s geriatric interview, corresponding to assessments begun in 1996. It is not an archival photograph of Rockwood, a participant or a particular study site. The timeline date identifies publication in 2005.

Clinical judgment informed by an interview, history and examination. The illustration supplies no scoring rules and assigns no score from a person's appearance.
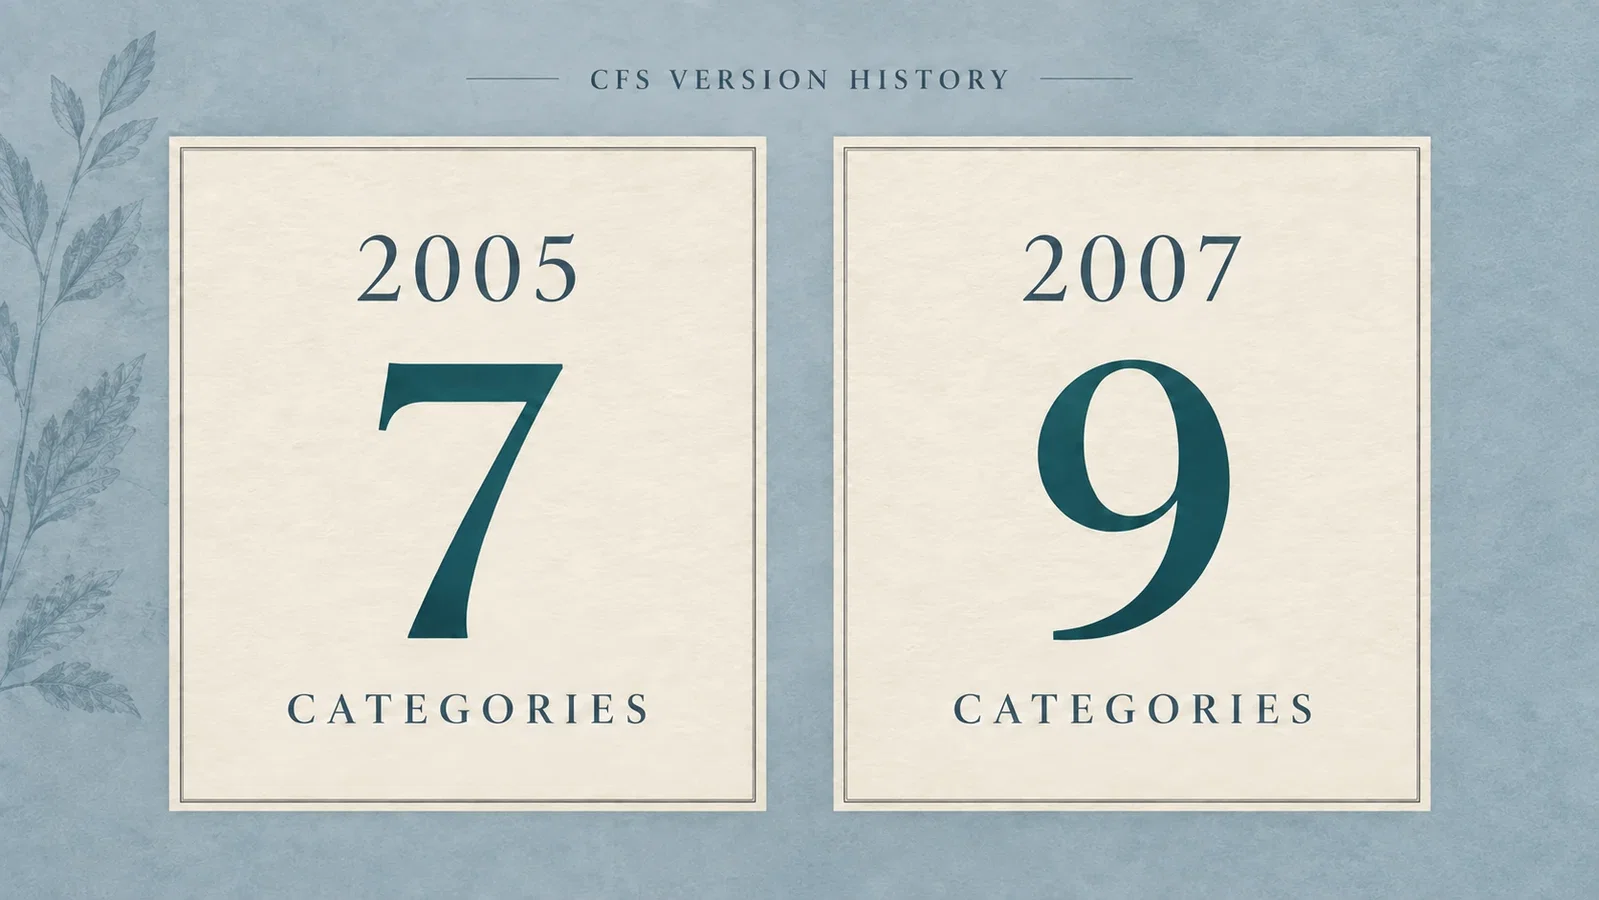
Seven categories in 2005 and nine in 2007, as dated by the research group. The numbers indicate version size, not patient scores; this is not a complete scoring card.
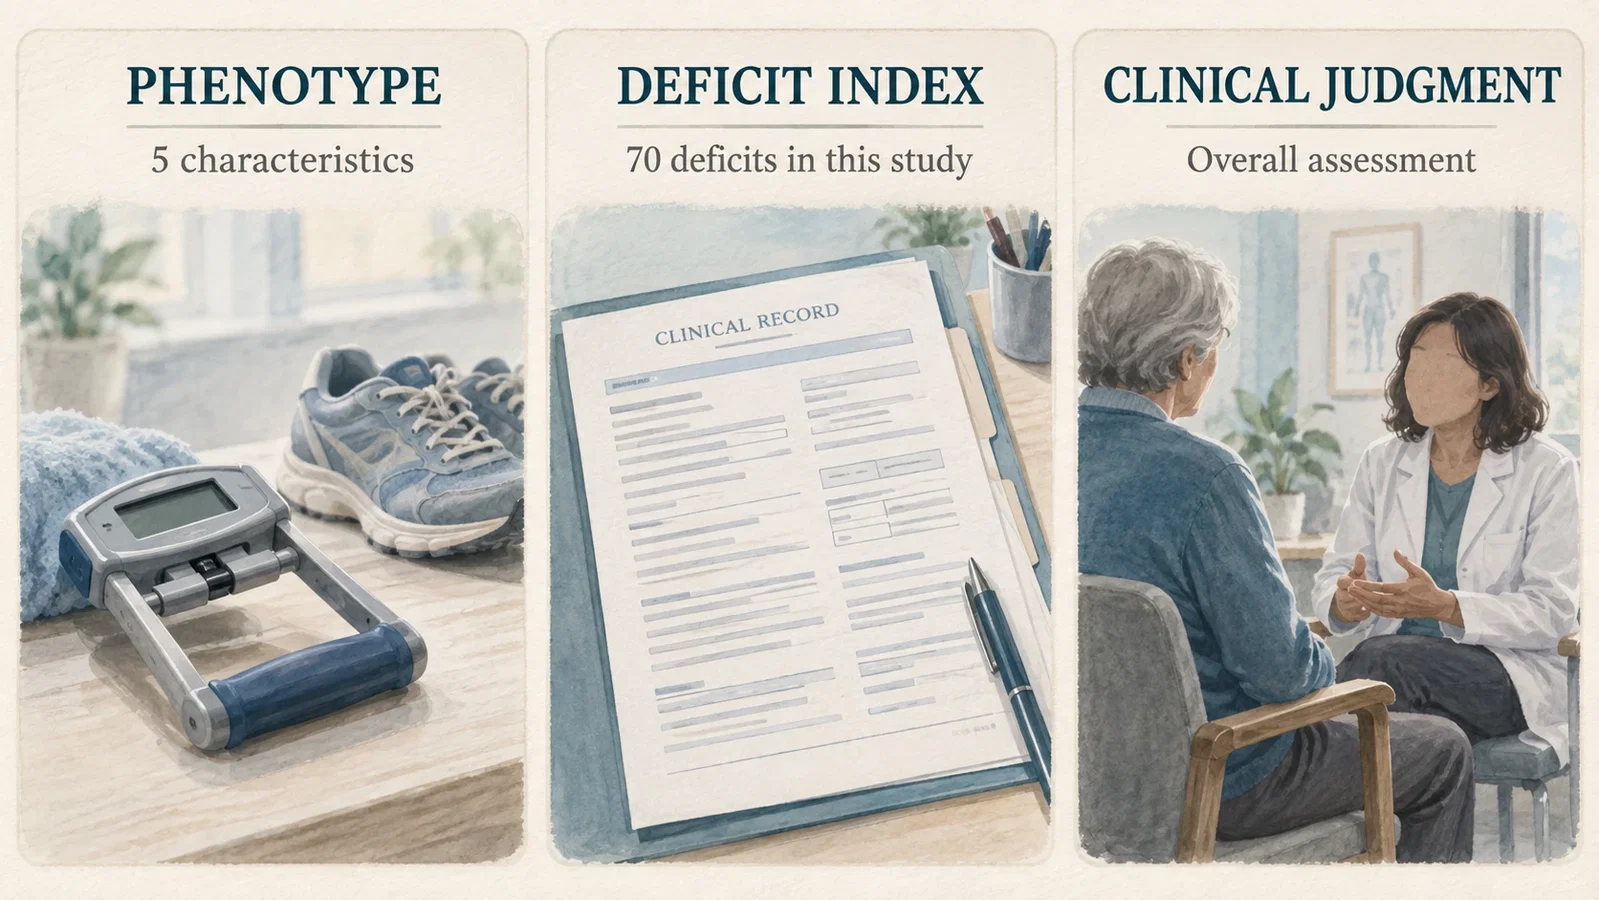
An editorial comparison of a five-characteristic phenotype, the study's 70-deficit index and clinical judgment. No ranking, direct lineage or score conversion is implied.
Sources and reading limits
- Rockwood K, Song X, MacKnight C, et al. A global clinical measure of fitness and frailty in elderly people. CMAJ. 2005;173(5):489–495. DOI:10.1503/cmaj.050051; PMID 16129869. PMC original. Complete text, 39 references and seven original table/figure images read.
- Dalhousie University, Geriatric Medicine Research. Clinical Frailty Scale. The group's account of the 2005, 2007 and 2020 versions and its description of the instrument; not an independent replication.
- Duke D. Measuring frailty in geriatric patients. CMAJ. 2006;174(3):352–353. DOI:10.1503/cmaj.1050199; PMID 16446482. Original letter, read in full.
- Rockwood K, MacKnight C, Bergman H. Measuring frailty in geriatric patients. CMAJ. 2006;174(3):353. DOI:10.1503/cmaj.1050249. Original reply, read in full. Its cited intervention studies were not separately reviewed here.
- Fried LP et al. Frailty in older adults: evidence for a phenotype. J Gerontol A Biol Sci Med Sci. 2001;56(3):M146–M156. DOI:10.1093/gerona/56.3.m146. Original PDF in a public archive. From an archived copy; pages M146 and M149 read.
- Makary MA et al. Frailty as a predictor of surgical outcomes in older patients. J Am Coll Surg. 2010;210:901–908. DOI:10.1016/j.jamcollsurg.2010.01.028. Original PDF in a university archive. From an archived copy; pages 901–903 and 908 read. The other four pages were not reread.
The 2005 text and Table 2 give different per-category risk estimates. Those estimates are not used here, and the originals have not been altered. The letter and reply linked to the original NLM record were read; no observed erratum link does not establish that no correction exists. All images are modern editorial illustrations in the original landscape format.
Continue exploring
Related reading connects shared questions and contexts; it does not by itself establish historical influence.
- 2001: Fried's Frailty Phenotype Makes a Clinical Concept Measurable
- 2010: Makary's Five-Item Study Brings Frailty into Preoperative Assessment
Anesthesia Epochs · The Source Room · About & Editorial Method
Sources and reading limits are stated above. Illustrations are labelled as original source images or AI-made. Historical accounts are educational; they are not current treatment instructions.