In 2010, a cohort of 594 older elective-surgery patients made grip strength, walking speed, and physiologic reserve visible beyond conventional risk scores.
Reading Library · Anesthesia Epochs · 中文版
Watch the companion film
2010: Makary — Frailty and Surgical Outcomes · Watch on YouTube
Historical anchor: 2010. Date details and source qualifications are explained below.
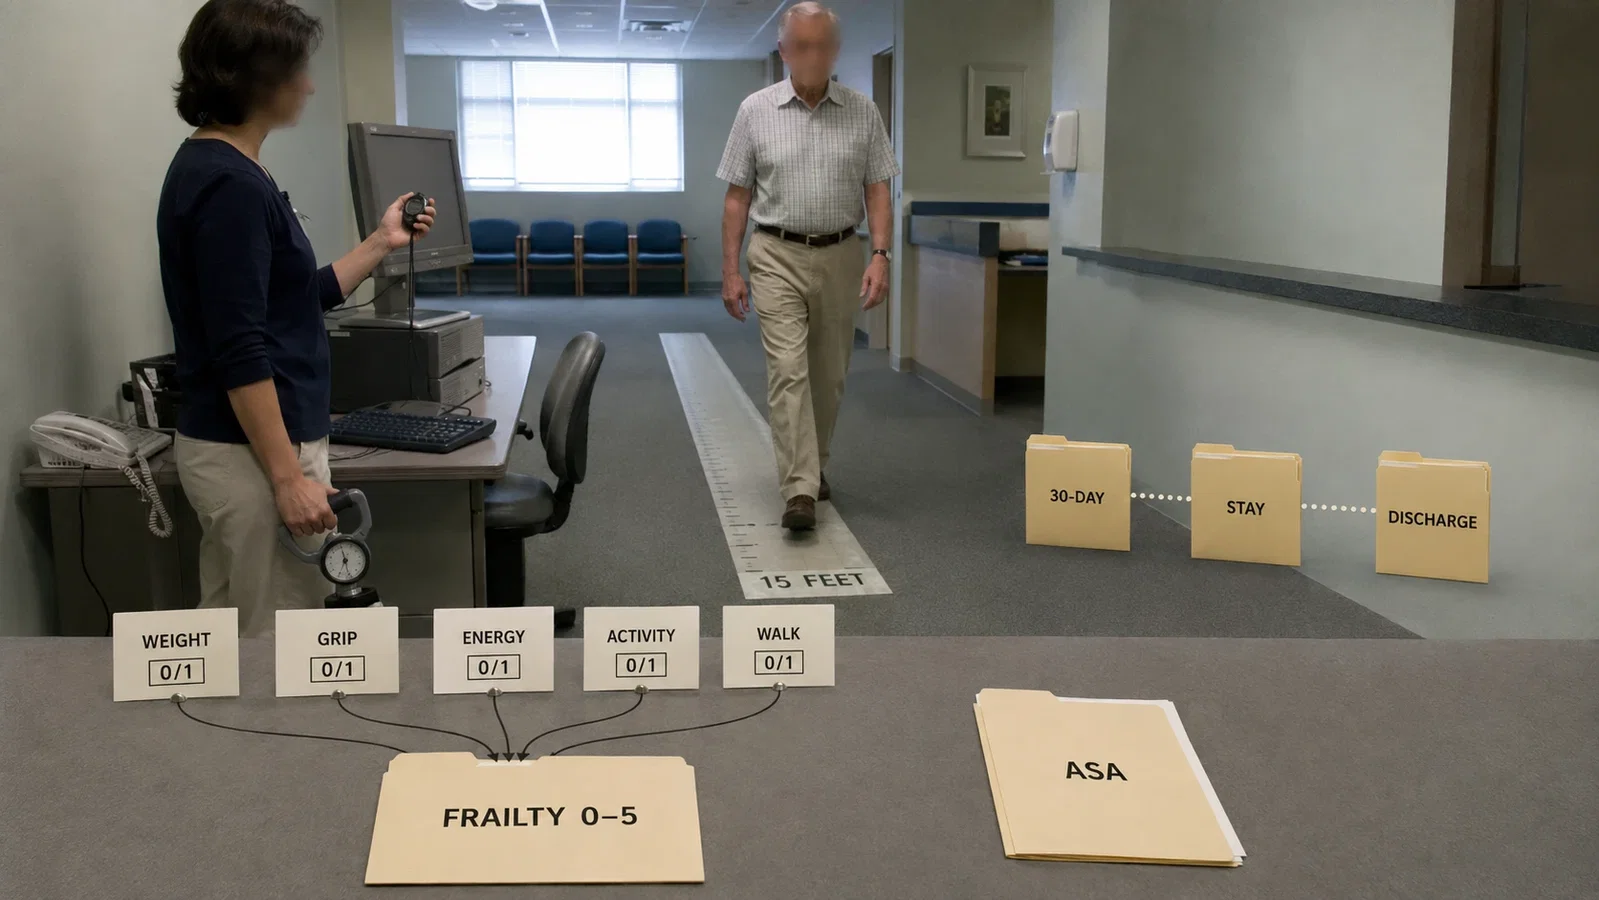
The most revealing instrument in this study was not a new monitor. It was a hand dynamometer.
On a preoperative visit, an older patient squeezed it three times with the dominant hand. A research assistant also asked about weight loss, exhaustion, and recent activity, then timed a 15-foot walk. Five ordinary observations, each scored zero or one, were assembled into an estimate of something clinicians had long judged by impression: how much reserve a patient might have when surgery imposed stress.
When Martin Makary and colleagues published their results electronically on 28 April 2010, they did not claim to have invented frailty. Linda Fried and colleagues had already operationalized a five-component phenotype in community-dwelling older adults. The surgical study asked a different question. Could that phenotype add useful information before an operation, beyond familiar measures such as ASA physical status and the Lee and Eagle cardiac risk indices?
The assessment replaced an impression with five tasks
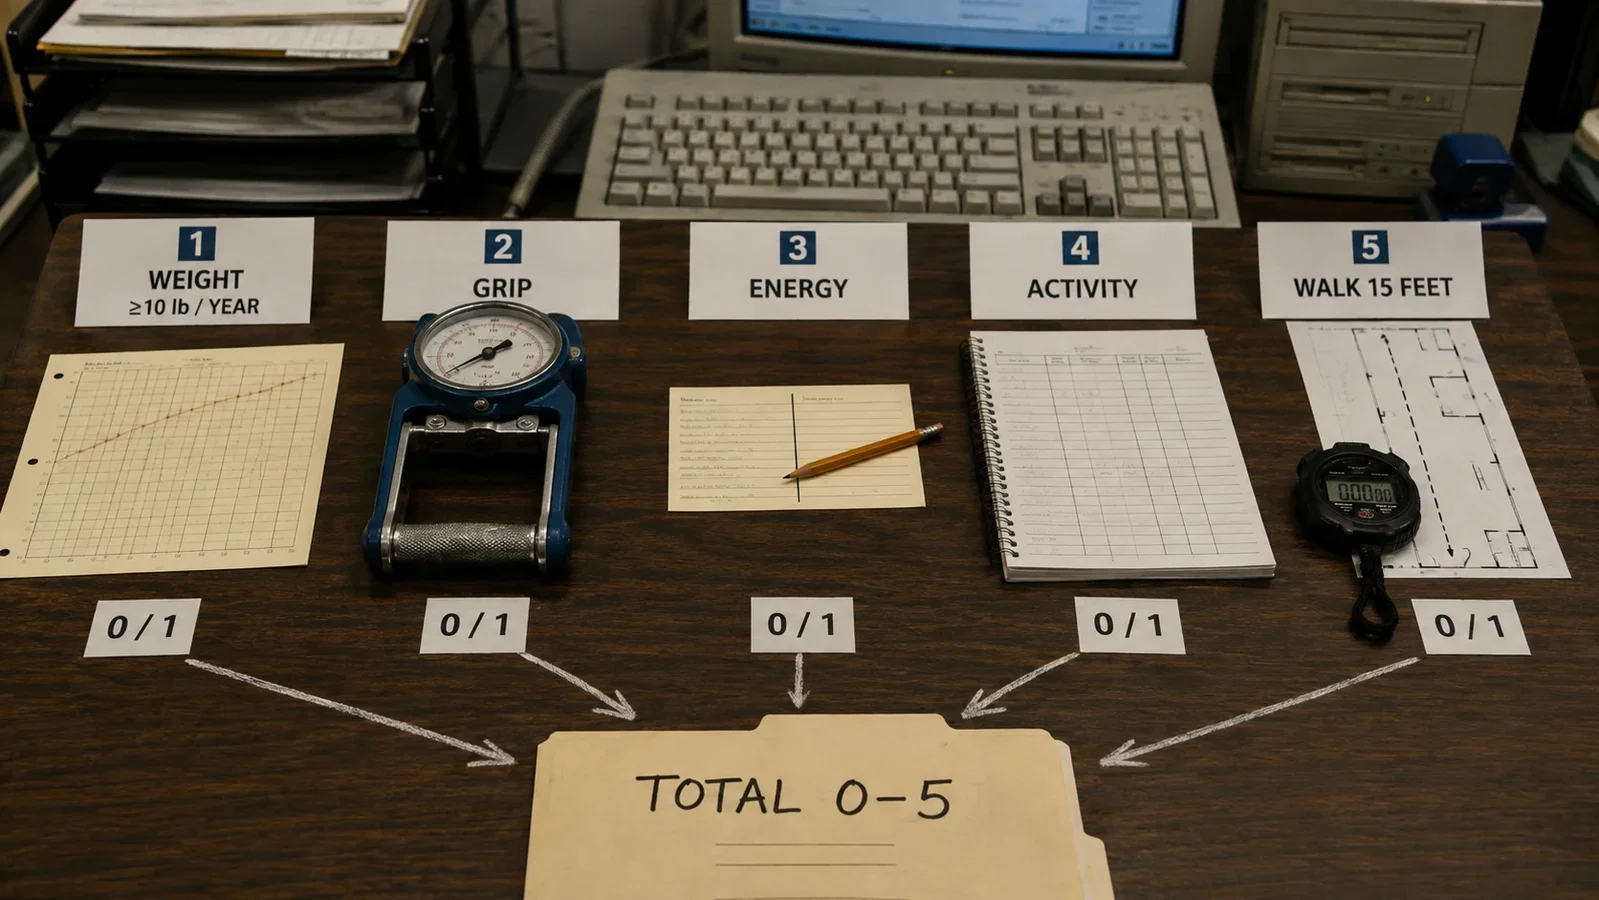
The five domains were related, but they did not measure the same thing.
Shrinking meant at least 10 pounds of unintentional weight loss during the previous year. Weakness was measured with a hand-held dynamometer: three maximum-grip trials were averaged and interpreted against sex- and BMI-specific thresholds. Exhaustion came from two brief questions about effort and the inability to get going. Low activity was based on reported leisure activity during the preceding two weeks. Slowness was the average of three trials walking 15 feet at a normal pace, interpreted using sex and height.
Each domain contributed one point to a total from zero to five. The combination mattered because frailty was not being used as a synonym for age, disability, or the number of diagnoses in a chart. An older person did not need to look ill, use a wheelchair, or fit a visual stereotype to meet one or more criteria. The assessment replaced that impression with recorded measurements.
The authors reported that the full assessment took about 10 minutes in a busy surgical practice. That was a feasibility observation from this setting, not proof that every clinic could implement it with the same staffing, time, or cost.
The denominator began at 666, not 594
The study was prospective and observational. It took place at the Johns Hopkins Hospital anesthesia preoperative evaluation center from 22 June 2005 through 1 July 2006. Patients were aged 65 or older and were preparing for elective surgery.
Recruitment did not cover every patient on every day. The team sampled selected weekdays and rotated those days regularly. On sampled days, 666 patients were eligible. Twenty-one declined participation and two later withdrew. Another 49 were excluded under the study's stated neurologic, cognitive, or medication criteria: two had Parkinson disease, 11 had a previous stroke, two had a Mini-Mental Status Examination score below 18, and 34 were taking selected medications whose effects could overlap with components of the phenotype. The final cohort contained 594 people.
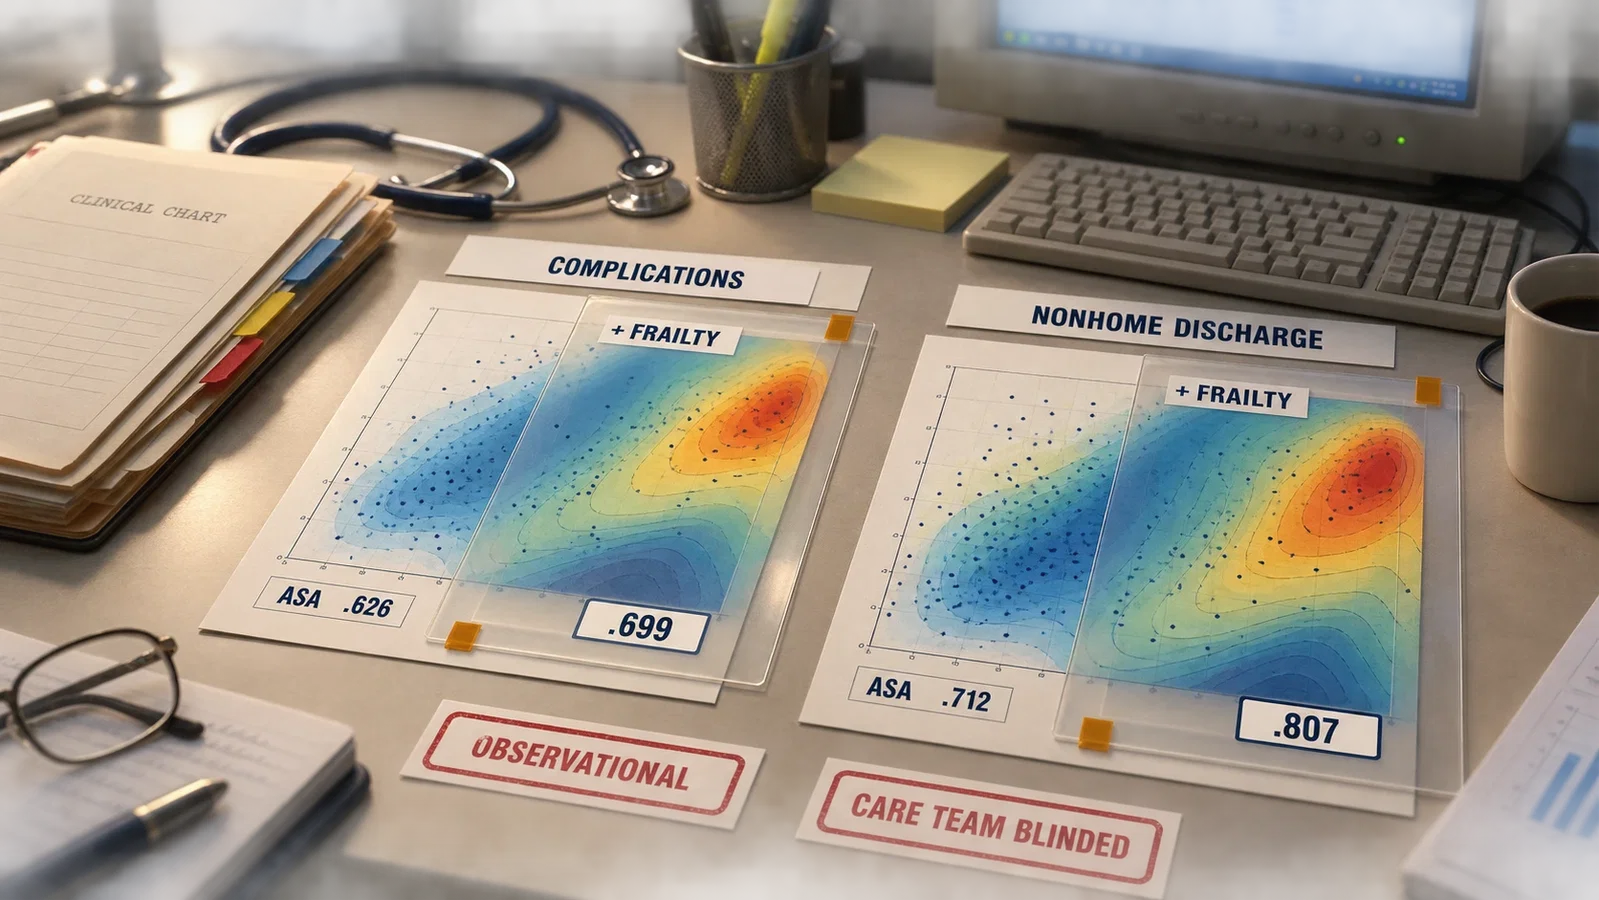
A research assistant conducted the interview and frailty assessment. The authors responsible for analysis had not collected the data. An anesthesiologist assigned the ASA score independently while blinded to the frailty score, and clinical providers were also blinded to the frailty result.
These separations strengthened the comparison between frailty and existing risk information. They also define what the study could not test. A team that never saw the score could not change care because of it, so the study did not ask whether disclosing frailty, altering an anesthetic plan, adding geriatric co-management, or beginning prehabilitation would improve an outcome.
The surgical study changed the category boundaries
The five domains came from an established phenotype, but the three labels used in the surgical paper were not imported unchanged from Fried's original report.
Makary and colleagues first examined the relation between the zero-to-five score and events within their own surgical data. Their exploratory analysis found similar odds within three bands. They then classified zero or one criterion as nonfrail, two or three as intermediately frail, and four or five as frail.
That distinction is easy to lose in later summaries. The 2001 Fried abstract defines one or two criteria as intermediate and three or more as frail. Makary's 0–1 / 2–3 / 4–5 bands were a study-specific grouping derived after examining this surgical cohort. They were also unrelated to the later Rockwood Clinical Frailty Scale and to modified frailty indices that accumulate deficits. A score of four has no stable meaning if the instrument itself is not named.
Within the 594 participants, 346 were classified as nonfrail, 186 as intermediately frail, and 62 as frail. Those proportions, 58.3%, 31.3%, and 10.4%, describe this selected single-centre elective-surgery cohort. They are not a general prevalence estimate for all older surgical patients.
Three outcomes placed reserve beside postoperative events
The main outcomes were surgical complications within 30 days, defined using NSQIP criteria; length of hospital stay; and discharge to a skilled or assisted-living facility among patients who had lived at home before surgery.
In the forced model that included all specified adjustment factors, the odds ratio for a complication was 2.06 for the intermediately frail group compared with the nonfrail group, with a 95% confidence interval of 1.18 to 3.60. For the frail group, the odds ratio was 2.54, with a confidence interval of 1.12 to 5.77.
Length of stay was analysed with a negative binomial model. The corresponding incidence rate ratios were 1.49, with a 95% confidence interval of 1.24 to 1.80, and 1.69, with a confidence interval of 1.28 to 2.23. These ratios describe relative expected stay in the model. They do not mean that patients stayed an extra 1.49 or 1.69 days.
The discharge association was larger and less precise. Among patients who had lived at home, the odds ratio for discharge to a skilled or assisted-living facility was 3.16 for the intermediate group, with a confidence interval of 1.00 to 9.99. For the frail group it was 20.48, but the interval stretched from 5.54 to 75.68. Reporting the point estimate without that wide interval would turn uncertainty into false visual certainty.
All of these were adjusted associations. The cohort was not randomized to a frailty state, a screening strategy, or a treatment. Words such as prevented, caused, or saved would describe a study that was not performed.
What did frailty add to conventional scores?
The paper's second contribution was not simply that outcomes differed across groups. It tested whether the phenotype added discrimination to three familiar risk indices.
The cleanest comparison is the cross-validation analysis. For surgical complications, adding frailty increased the area under the curve from 0.626 to 0.699 for ASA, from 0.618 to 0.669 for Lee, and from 0.678 to 0.714 for Eagle. For discharge to a skilled or assisted-living facility, the corresponding changes were 0.712 to 0.807, 0.669 to 0.795, and 0.661 to 0.759.
The table also contained original-dataset rows with different estimates and p values. Two original-dataset comparisons for complications did not meet conventional significance thresholds, even though the cross-validation rows did. This matters because the abstract's compact statement that frailty improved each index at p < .01 should not be laid over every cell in the table.
An increase in AUC means the models separated groups somewhat better after the new information was added. It does not mean that a score foretold one person's recovery, or that more accurate classification automatically produced better care.
Uptake came before proof of an intervention
The authors described their work as the first known study of preoperative frailty and surgical outcomes. That is their priority claim, not the result of an independent worldwide search. The 2012 guideline shows how quickly the measure entered practice guidance.
In 2012, the joint ACS NSQIP and American Geriatrics Society best-practice guideline for older surgical patients included “determine baseline frailty score” in its preoperative assessment list. Its frailty section summarized the surgical associations, and Appendix III reproduced the five-item score with permission. Within two years of publication, the phenotype had moved from a single research protocol into a professional assessment framework.
Guideline uptake did not erase the original limits. The study measured short-term outcomes, not long-term function or quality of life. It did not include potentially useful laboratory variables such as blood counts or albumin. It came from one academic medical centre, and its sampling and exclusions constrain generalizability. Most importantly, providers were blinded to the score, so the study could not reveal the effect of knowing it.
The 2010 paper therefore marks a change in what could be discussed before surgery, not the completion of a treatment pathway. Weight history, grip, energy, activity, and walking speed gave clinicians a reproducible way to describe reserve that age and disease lists did not fully capture. Whether acting on that information would alter recovery remained a question for later trials.
The dynamometer did not predict a patient's destiny. It made one part of the patient's starting condition harder to ignore.
Sources and reading limits
Sources: Makary MA, Segev DL, Pronovost PJ, et al. J Am Coll Surg. 2010;210(6):901–908. DOI 10.1016/j.jamcollsurg.2010.01.028; Fried LP, Tangen CM, Walston J, et al. J Gerontol A Biol Sci Med Sci. 2001;56(3):M146–M156. PMID 11253156; ACS NSQIP/AGS Best Practices Guidelines: Optimal Preoperative Assessment of the Geriatric Surgical Patient. 2012. The complete Makary article was read in full, with all eight pages visually inspected; the guideline's relevant sections and appendix were read. Fried 2001 is used only at official-abstract level.
Visual interpretations
These illustrations explore the setting and ideas. Depicted people, actions, instruments and documents are reconstructions, not evidence of their exact historical appearance.

Continue exploring
Related reading connects shared questions and contexts; it does not by itself establish historical influence.
- 1941: Saklad's Physical Status Gives Patient Records a Shared Language
- 2001: Fried's Frailty Phenotype Makes a Clinical Concept Measurable
- 2005: Rockwood's Clinical Frailty Scale Tests a Clinical Judgment
- 2015: Care for the Older Surgical Patient Becomes a Perioperative Pathway
- 2022: POISE-3 Finds Tranexamic Acid Cuts Bleeding Without Proven Cardiovascular Noninferiority
- 2024: GPT-4 Turbo Classifies Preoperative Text but Struggles to Predict Duration
- 2024: Nine Organizations Turn Preoperative Cardiac Clearance into a Continuous Pathway
The Source Room · About & Editorial Method
Sources and reading limits are stated above. Illustrations are labelled as original source images or AI-made. Historical accounts are educational; they are not current treatment instructions.