Definition, measurement and prognosis in a 2001 community study.
Reading Library · Anesthesia Epochs · 中文版
Watch the companion film
2001: Fried — The Frailty Phenotype · Watch on YouTube
Historical anchor: 2001. Date details and source qualifications are explained below.
March 2001 · An operational definition in a community cohort
An older adult could have a weaker grip and slower walking speed while still managing everyday life independently. A research definition needed to capture that distinction and make it possible to examine what followed. In March 2001, Linda P. Fried, Catherine M. Tangen, Jeremy Walston and colleagues in the Cardiovascular Health Study reported a phenotype built from five measurable characteristics. They were organizing and testing an existing clinical concept; the paper did not mark the discovery of frailty itself.[1, pp.M146–M148]
The study drew on prospective observational data from the Cardiovascular Health Study. Its original cohort had been recruited from four US communities in 1989–1990. An additional cohort of African American participants entered at three of those sites in 1992–1993. After exclusions and requirements for evaluable measurements, the analysis included 5,317 community residents aged 65 or older. Maximum follow-up differed: seven years for the original cohort and four for the later cohort. Seven-year estimates applied only to the original cohort. These were not 5,317 surgical patients enrolled in an anaesthesia trial.[1, pp.M147–M149; Table 6 footnote]
The five characteristics were unintentional weight loss, self-reported exhaustion, weakness measured by grip strength, slow walking and low physical activity. In the 2001 paper, three or more positive criteria identified the frail group. One or two defined an intermediate, possibly prefrail group, while people with no criteria were classified as robust. Three positive criteria must also be distinguished from the study's separate requirement that at least three components have nonmissing data before a participant could be evaluated.[1, p.M148, Table 1; p.M156, Appendix]
Each component depended on a specified measurement. Grip strength was measured with a handheld dynamometer, and walking time over 15 feet at the participant's usual pace. Grip thresholds were stratified by sex and body mass index; walking thresholds by sex and height. Exhaustion and activity were derived from specified questionnaire items. Appearance alone, or a total score without its measurement rules, could not reproduce the phenotype. This account describes the components without turning them into a substitute for clinical assessment.[1, pp.M148,M156]
Among the analysed participants, 368 met the frailty definition, a reported prevalence of 6.9%. Figure 3 made another distinction visible. Frailty, comorbidity and disability in activities of daily living overlapped, but they did not identify identical groups. Comorbidity in that diagram meant at least two of nine specified diseases; disability meant difficulty with ADLs. Frail participants outside the other two sets could still have a chronic disease. Keeping those definitions separate made it possible to study disease burden, function and frailty without treating the terms as interchangeable.[1, pp.M149–M151, Table 2 and Figure 3]
The investigators then examined prognosis. In Table 7, the adjusted hazard ratio for death over three years was 2.24 for the frail group relative to the group with no criteria, with a 95% confidence interval of 1.51–3.33. That estimate describes an adjusted association in an observational cohort. It is neither a percentage of participants who died nor evidence that performing a frailty assessment reduces mortality. Hospitalization, declining mobility, disability and falls were also examined. Those outcomes require separate reading: the adjusted results cannot all be described as statistically significant.[1, pp.M149,M152–M153, Table 7]
The definition retained the limits of its data. The analysis excluded participants with Parkinson's disease, stroke, a Mini-Mental State Examination score below 18 or use of specified medications. Those exclusions restrict the population represented. The authors also noted that the measurements had originally been collected for other research purposes and that weight loss before baseline relied on self-report. Their proposed physiological cycle remained a hypothesis. Prediction did not, by itself, establish that causal mechanism.[1, pp.M148,M154]
The connection to the later 2010: Makary's Five-Item Study Brings Frailty into Preoperative Assessment can be located in its methods and references. The 2010 paper cited Fried 2001 and used the same five domains in older adults undergoing elective surgery. Its exploratory analysis, however, led to different groups: 0–1, 2–3 and 4–5 criteria. The frail group in that surgical study therefore cannot be substituted for the original group with at least three criteria. Shared domains did not make the classification or population identical.[2, pp.901–903,908]
The 2015: Care for the Older Surgical Patient Becomes a Perioperative Pathway provides a further, specific point of comparison. Its 2012 preoperative assessment guide gave frailty a dedicated section and described the measurements in an appendix. That version also used the 0–1, 2–3 and 4–5 grouping; the appendix identified the material as reproduced from Makary 2010. The documents show a research instrument entering preoperative assessment, with changes in classification visible along the way. Later surgical work cannot be read back into the 2001 community study as evidence already available then.[3, pp.13,29,48]
Fried and colleagues supplied a definition that could be measured, compared and challenged. It distinguished people of similar age while preserving separate meanings for comorbidity and functional disability. Its place in anaesthesia history rests on tracing how those measurements entered preoperative assessment, and checking whether the population, grouping and conclusions remained the same each time the tool was used.[1, p.M154;2, pp.902–903;3, pp.13,29]
Images

Modern editorial reconstruction of community walking assessment; not a historical photograph of Fried or a CHS participant, or an exact reconstruction of a study site.
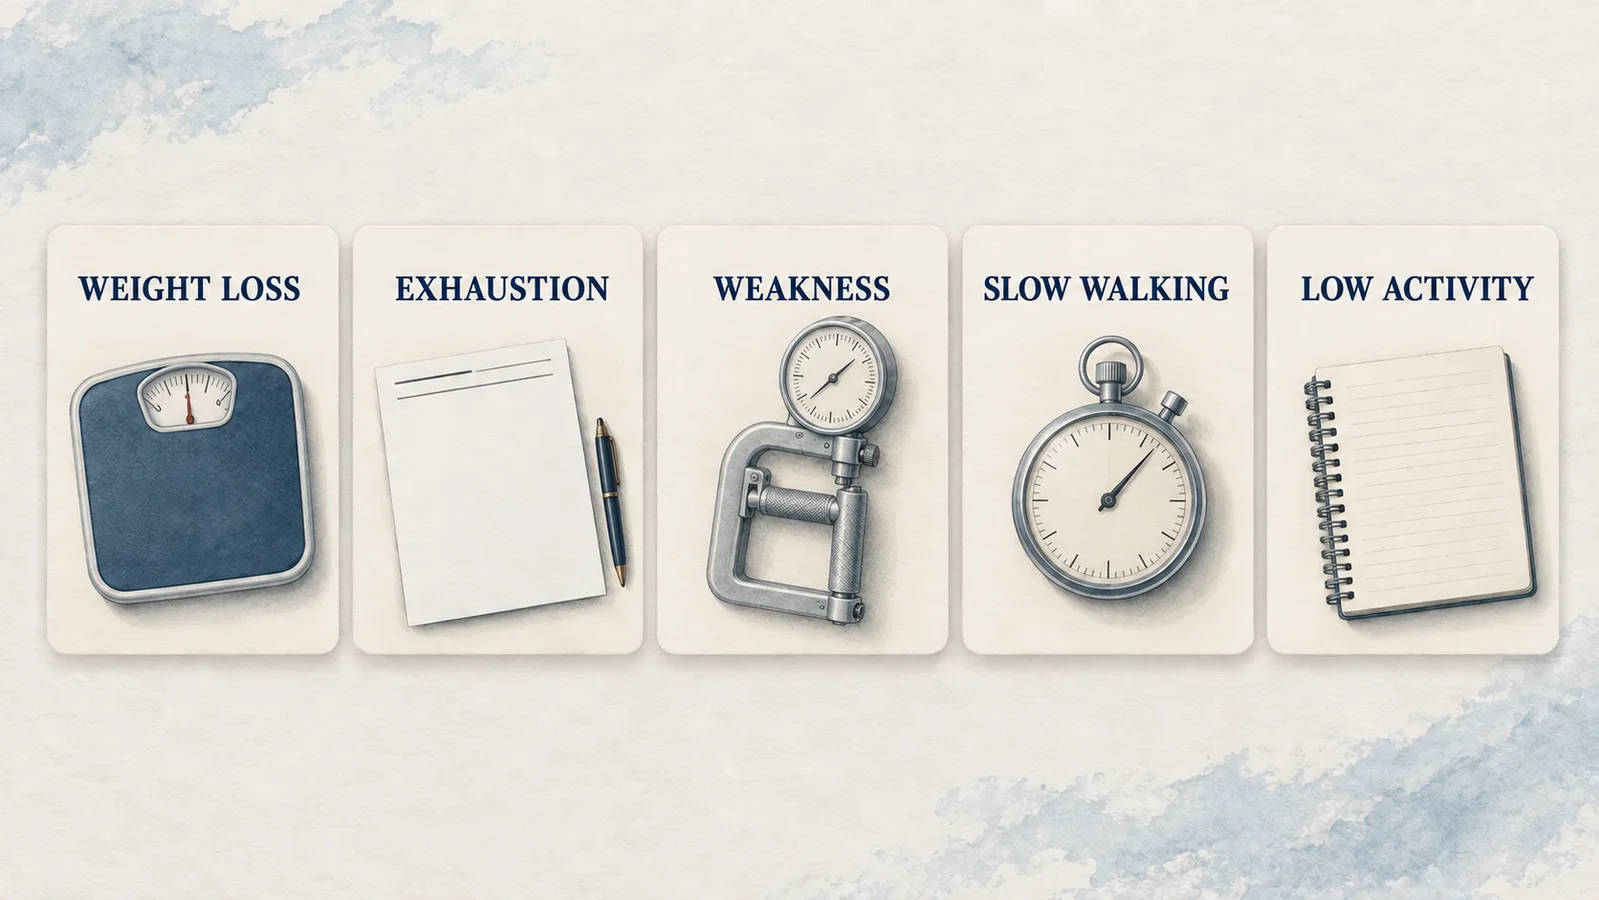
The five measurement domains. The illustration supplies no diagnostic thresholds or clinical algorithm.
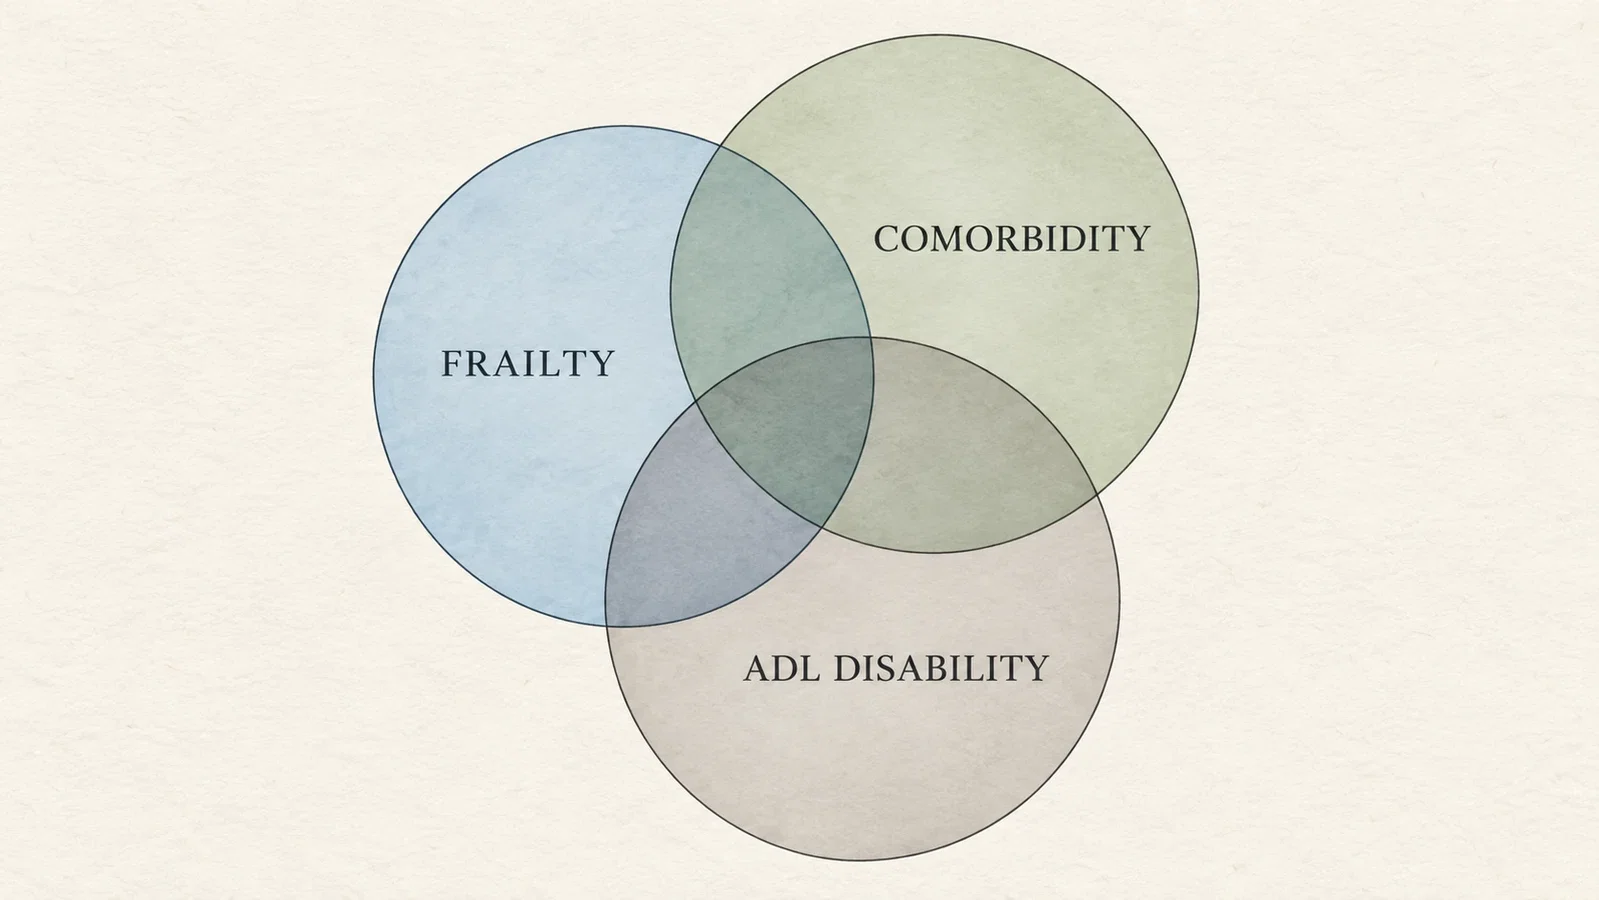
Frailty, comorbidity and ADL disability overlap without being synonyms. Circle sizes and overlap areas do not represent participant counts or proportions.
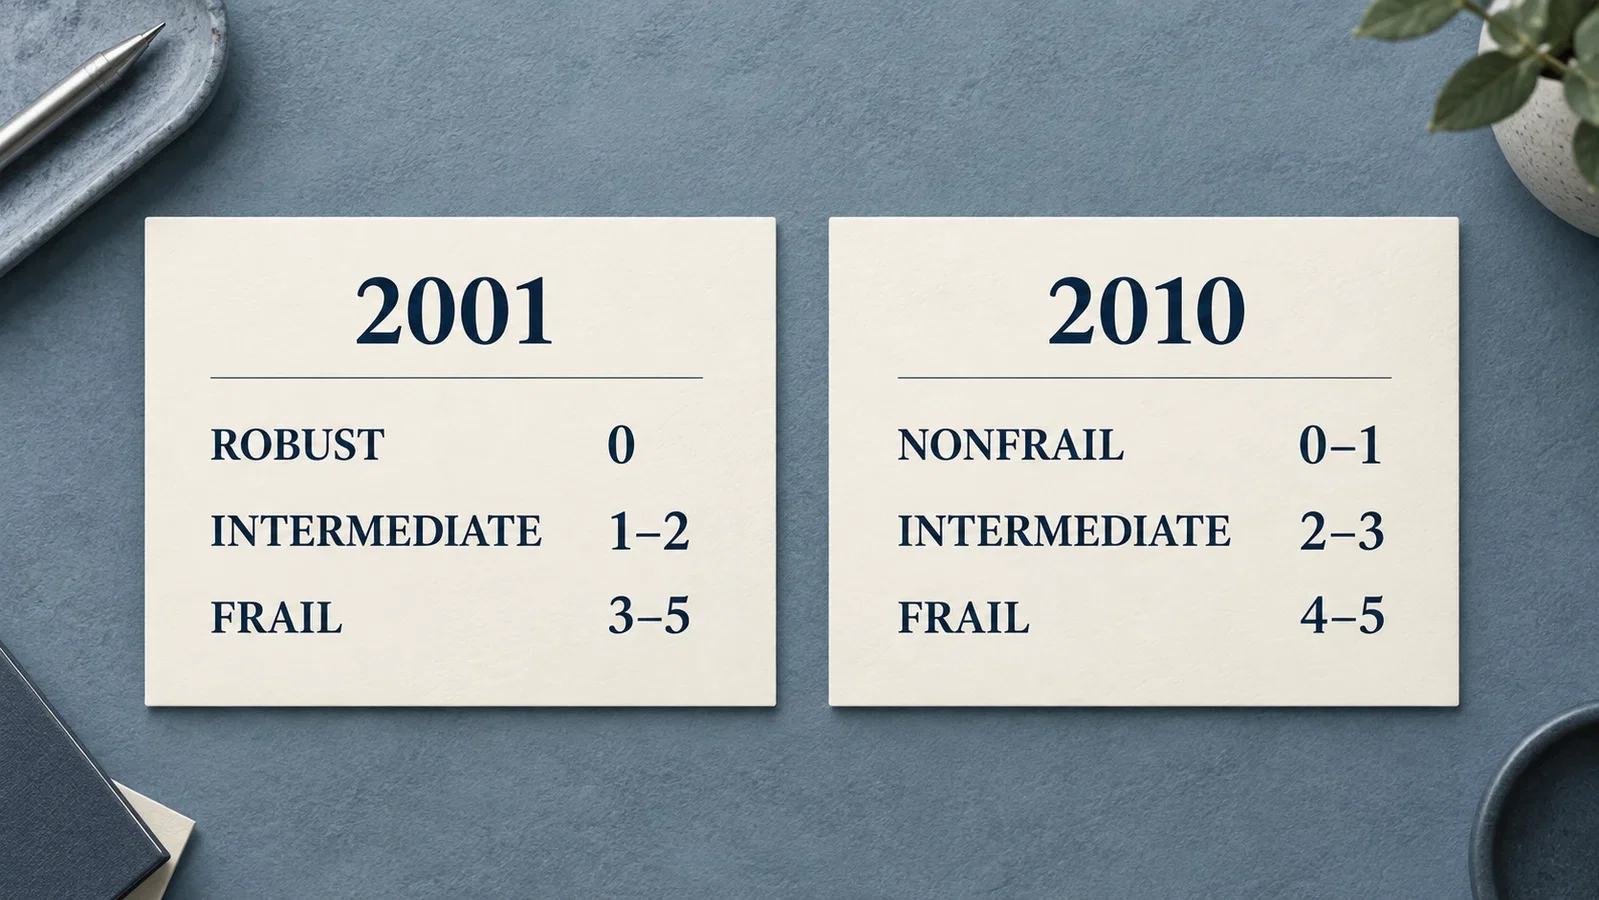
The 2001 community study and the 2010 surgical study used different groups. This is a historical comparison, not a current scoring recommendation.
Sources and reading limits
- Fried LP, Tangen CM, Walston J, et al. Frailty in older adults: evidence for a phenotype. J Gerontol A Biol Sci Med Sci. 2001;56(3):M146–M156. DOI:10.1093/gerona/56.3.m146; PMID 11253156. Original-layout PDF in a public literature archive. All eleven article pages, including tables, figures and the appendix, read. The twelve-page PDF also contains an advertisement at M157; publisher and Crossref end-page metadata differ from the article header and NLM.
- Makary MA, Segev DL, Pronovost PJ, et al. Frailty as a predictor of surgical outcomes in older patients. J Am Coll Surg. 2010;210:901–908. DOI:10.1016/j.jamcollsurg.2010.01.028. Original PDF in a university archive. Read from an archived copy; pages 901–903 and 908 reread for methods and citations. The other four pages were not reread here, and their full results are not retold.
- American College of Surgeons NSQIP / American Geriatrics Society. Optimal Preoperative Assessment of the Geriatric Surgical Patient. 2012. Official guideline PDF. Read from an archived copy; cover and printed pages 13, 29 and 48 reread. Its use and citation of earlier work are not an independent replication of CHS data.
The original paper differs internally on the exact weight-loss boundary, and its Table 3 sex headings do not agree with participant counts elsewhere. This account retains the five domains and consistent grouping rules without silently correcting the paper or reproducing the disputed details. Falls are assessed from Table 7 individually. NLM comment links were checked, but comment bodies were unavailable; no observed erratum link does not establish the absence of a correction. All four images are modern editorial illustrations in the original landscape format.
Sources and reading limits are stated above. Illustrations are labelled as original source images or AI-made. Historical accounts are educational; they are not current treatment instructions.
Continue exploring
Related reading
Related reading connects shared questions and contexts; it does not by itself establish historical influence.